
Bitcoin Dives Below $75K for First Time in a Month as Crypto Liquidations Near $1 Billion
Bitcoin falls below $75K for the first time in a month, leading to nearly $1 billion in liquidations.
Decrypt1 min read

Bitcoin's price has fallen below $80,000, with recent data indicating a significant drop in the Bitcoin Coinbase Premium Gap. This decline follows a brief recovery above $82,000 earlier in the week.
Data shows the Bitcoin Coinbase Premium Gap has plunged into the red zone alongside the latest drop in the BTC spot price below the $80,000 level.
Bitcoin saw recovery surges above $82,000 on Sunday and Monday, but these spikes failed to set the tone for the week as BTC has since followed a downward trajectory. This decline observed an acceleration on Wednesday, with the cryptocurrency’s price even briefly sinking below $79,000.
Below is a chart that shows the price action that Bitcoin has experienced recently.
The price of the coin has declined over the last few days | Source: BTCUSDT on TradingView
As is visible in the graph, Bitcoin has made some recovery from its low, as its price is now floating around $79,600, but compared to the Sunday high, it remains down about 3.3%.
Now, what was the cause behind the drop? The data of the Coinbase Premium Gap may provide some hints.
As pointed out by analyst Maartunn in an X post, the Bitcoin Coinbase Premium Gap has declined recently. This indicator measures the difference between the BTC spot price listed on Coinbase (USD pair) and that on Binance (USDT pair). When the value of the metric is positive, it means BTC is going for a higher rate on Coinbase than on Binance. Such a trend implies users of the former are applying a higher buying pressure (or lower selling pressure) than the latter’s traders.
On the other hand, the indicator having a sub-zero value suggests Binance investors may be applying a higher buying pressure as BTC is trading at a higher price on the platform.
The recent decline in Bitcoin's price is linked to the Bitcoin Coinbase Premium Gap plunging into the red zone.
Bitcoin's price briefly sank below $79,000 during its recent downward trajectory.
Before the decline, Bitcoin had surged above $82,000 on Sunday and Monday.
Bitcoin falls below $75K for the first time in a month, leading to nearly $1 billion in liquidations.

Bitcoin ETFs see over $1.25B in outflows, the worst since January.

How Bitcoin's Declining Transaction Volume Could Affect Prices
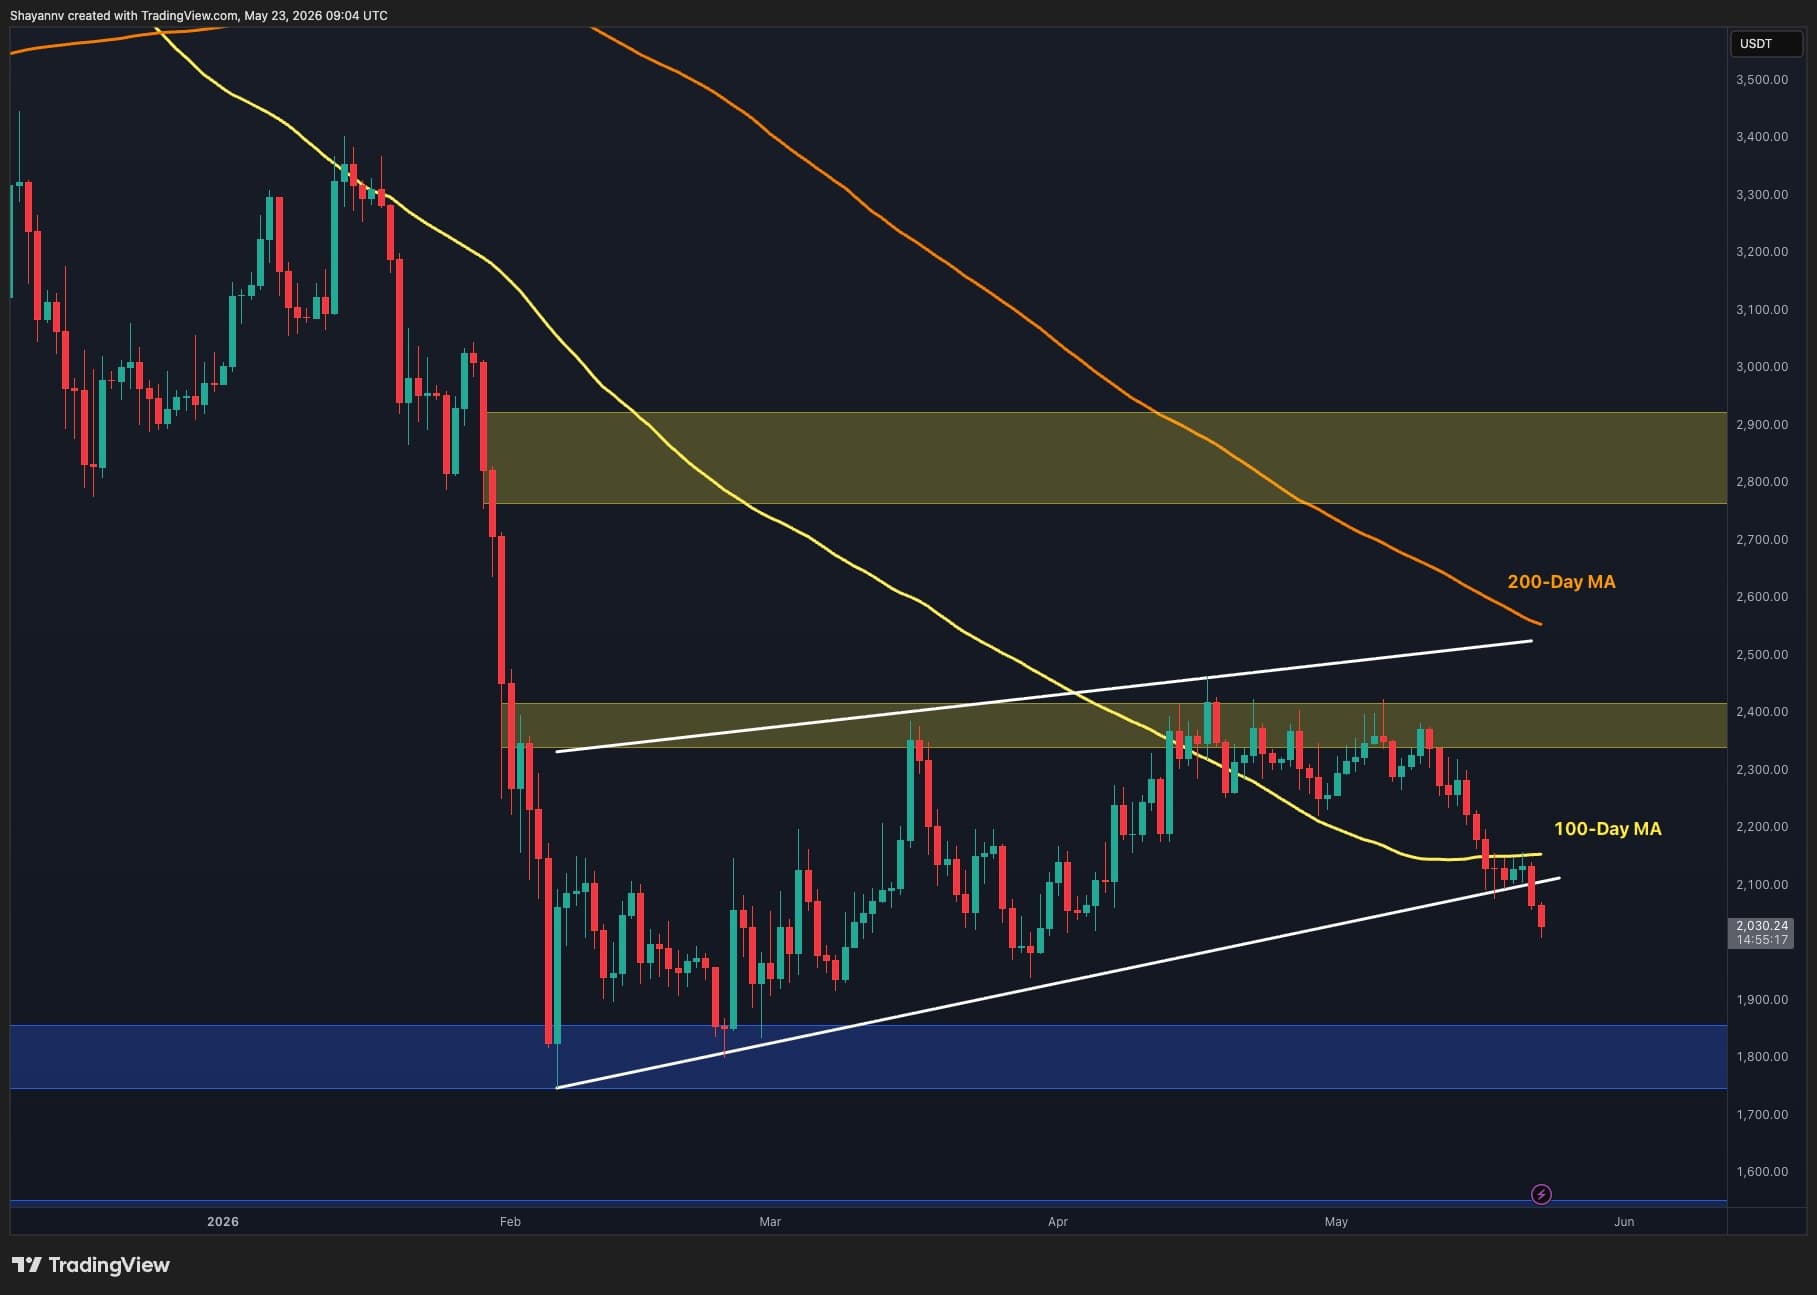
Ethereum faces pressure as it nears critical support; will it drop below $2K?

Argentina launched the 'Digital Twin' initiative to simulate social policy impacts using AI, but its promotional video was mocked for grammatical errors. Privacy experts raised concerns about governance and potential surveillance issues.

Cameron Winklevoss cites 39 trillion reasons to invest in Bitcoin amid rising US debt.
See every story in Crypto — including breaking news and analysis.
Now, here is the chart shared by Maartunn that shows the recent trend in the Bitcoin Coinbase Premium Gap:
The value of the indicator seems to have been red recently | Source: @JA_Maartunn on X
As displayed in the above graph, the Bitcoin Coinbase Premium Gap has dipped into the red zone recently, indicating that the asset has been trading at a discount on Coinbase. These negative values in the metric have coincided with the cryptocurrency’s pullback, a potential sign that selling pressure on the platform may have a role to play in it.
Bitcoin showing some correlation to the Coinbase Premium Gap isn’t a new development. In fact, it’s a pattern that has established itself in recent years. The reason behind it lies in the growing presence of the US-based institutional entities in the cryptocurrency sector, which happen to be the biggest users of Coinbase.
Movements in the indicator can correspond to selling/buying behaviors of these massive investors, which is why the price tends to react to them. It now remains to be seen how the metric will develop in the coming days and whether the distribution from the American whales will ease off.
Featured image from Dall-E, chart from TradingView.com
