
Ethereum TD Sequential Flashes Sell Signal – Is A New 50% Corrective Phase Starting?
Ethereum shows a new sell signal, raising concerns of a major correction as the CLARITY Act advances.
NewsBTC1 min read

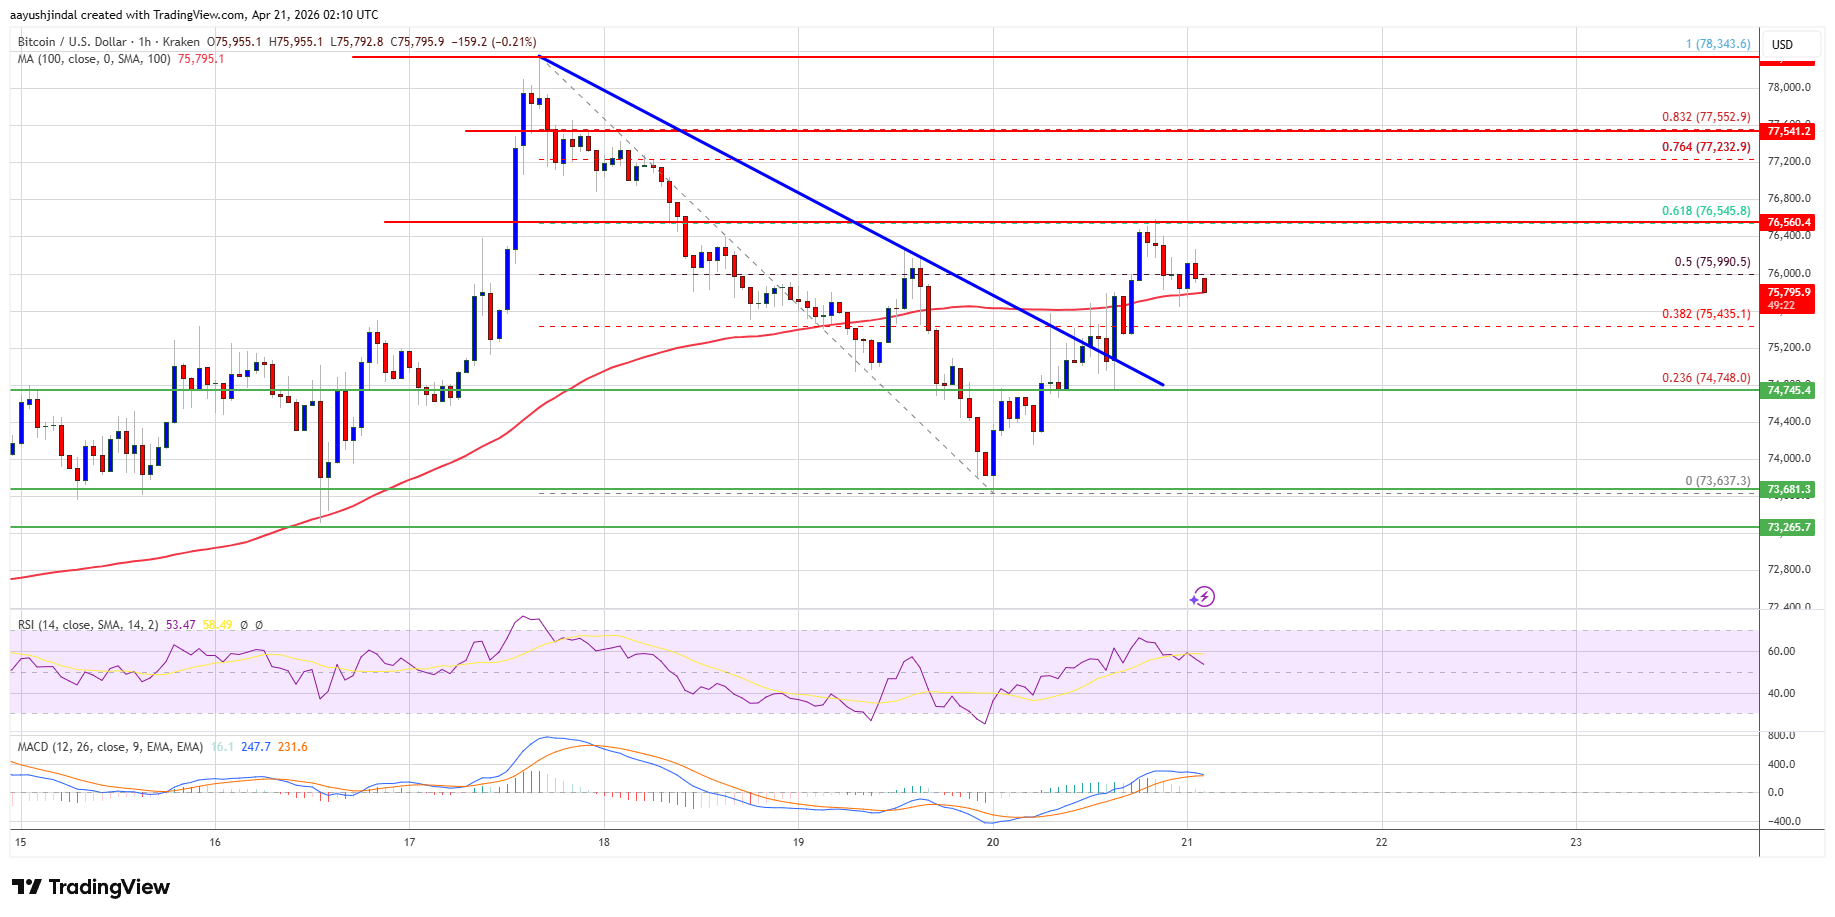
Bitcoin price is recovering from a low of $73,650 and is currently trading above $75,000. Traders are watching for a potential breakout above the $76,500 resistance zone.
Bitcoin price started a recovery wave from the $73,650 zone. BTC is consolidating and might struggle to clear the $76,500 resistance zone.
Bitcoin price extended losses below the $75,500 support zone. BTC even spiked below $74,000 before the bulls appeared. A low was formed at $73,637, and the price is now attempting to recover.
There was a move above the $74,500 and $75,000 levels. There was a break above a bearish trend line with resistance at $75,200 on the hourly chart of the BTC/USD pair. The pair even surpassed the 50% Fib retracement level of the downward move from the $78,344 swing high to the $73,637 low.
Bitcoin is now trading above $75,000 and the 100 hourly simple moving average. If the price remains stable above $75,000, it could attempt a fresh increase. Immediate resistance is near the $76,500 level and the 61.8% Fib retracement level of the downward move from the $78,344 swing high to the $73,637 low.
Source: BTCUSD on TradingView.com
The first key resistance is near the $77,250 level. A close above the $77,250 resistance might send the price further higher. In the stated case, the price could rise and test the $78,000 resistance. Any more gains might send the price toward the $78,500 level. The next barrier for the bulls could be $80,000.
If Bitcoin fails to rise above the $76,500 resistance zone, it could start another decline. Immediate support is near the $75,400 level.
Bitcoin is currently trading above $75,000 after recovering from a low of $73,650.
Bitcoin is attempting to clear the $76,500 resistance zone for potential bullish momentum.
Bitcoin has formed a base above $74,000 and has broken above a bearish trend line at $75,200.
Ethereum shows a new sell signal, raising concerns of a major correction as the CLARITY Act advances.

The CLARITY Act aims to establish comprehensive crypto market rules, potentially enhancing the U.S. dollar's role in global finance. However, it may also intensify competition with Asian crypto hubs over stablecoin capital.

Ethereum dips to $2,250 as profit-taking reaches a three-week high.

Join LBank's Futures Grid Trading campaign and earn up to 1,120 USDT in rewards!

Ripple Exec Celebrates Senate's Bipartisan Vote on CLARITY Act

How will the $2 billion Bitcoin options expiry affect the market today?
See every story in Crypto — including breaking news and analysis.
The first major support is near the $75,000 level. The next support is now near the $74,250 zone. Any more losses might send the price toward the $73,650 support in the near term. The main support now sits at $72,000, below which BTC might struggle to recover in the near term.
Technical indicators:
Hourly MACD – The MACD is now losing pace in the bullish zone.
Hourly RSI (Relative Strength Index) – The RSI for BTC/USD is now moving lower toward the 50 level.
Major Support Levels – $75,000, followed by $74,250.
Major Resistance Levels – $76,500 and $77,250.