
Bitcoin pressured by Fed uncertainty, oil, and AI slowdown
Bitcoin down 3% as traders await Fed rate decision and economic data
CoinDesk1 min read
Bitcoin price has declined from the $79,500 zone, struggling to maintain support above $76,500. Currently, it is trading below $78,000 with bearish pressure increasing.
Bitcoin price started a fresh decline from the $79,500 zone. BTC is consolidating and might struggle to stay above the $76,500 support.
Bitcoin price failed to stay above the $78,500 resistance zone. BTC formed a top near $79,500 and started a fresh decline. There was a move below the $78,000 level.
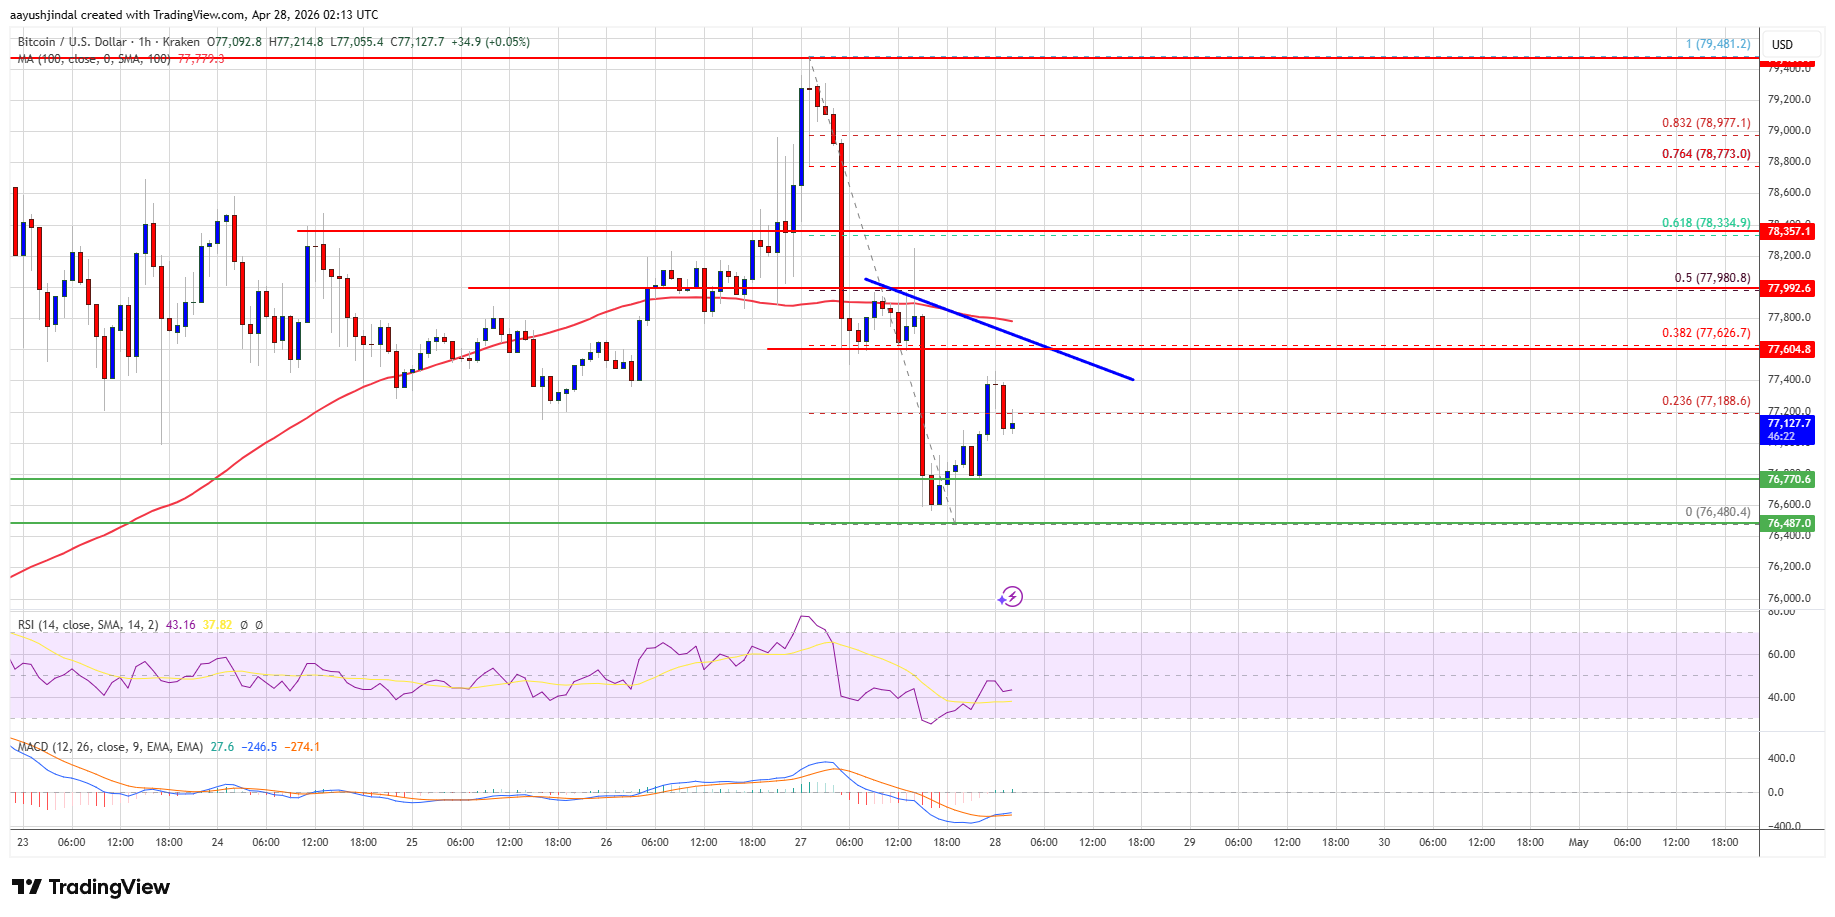
The price dipped below the $77,500 and $77,000 levels. A low was formed at $76,480 and the price is now consolidating losses. There was a minor increase above the 23.6% Fib retracement level of the downward move from the $79,481 swing high to the $76,480 low.
Bitcoin is now trading below $78,000 and the 100 hourly simple moving average. If the price remains stable above $76,500, it could attempt a fresh increase. Immediate resistance is near the $77,300 level.
The first key resistance is near the $77,600 level. There is also a connecting bearish trend line forming with resistance at $77,600 on the hourly chart of the BTC/USD pair. A close above the $77,600 resistance might send the price further higher.
Source: BTCUSD on TradingView.com
In the stated case, the price could rise and test the $78,000 resistance and the 50% Fib retracement level of the downward move from the $79,481 swing high to the $76,480 low. Any more gains might send the price toward the $78,500 level. The next barrier for the bulls could be $78,800.
Bitcoin is currently in a downward trend, having failed to stay above $78,500 and trading below $78,000.
Bitcoin is struggling to maintain support above $76,500, with significant pressure below $77,600 and $78,000.
During this decline, Bitcoin reached a low of $76,480.
Bitcoin down 3% as traders await Fed rate decision and economic data

XRP price drops below $1.420, facing resistance at $1.4120 and $1.4150.

XRP's recent price action shows a shift in trader confidence and risk appetite.

The Bitcoin Fear & Greed Index has reached a neutral score of 47, indicating a shift in trader sentiment for the first time since January. This change reflects a reduction in fear among Bitcoin traders.

Ethereum buyers are showing the most aggression since early 2023, pushing prices above $2,300.

Hyperliquid (HYPE) sees a 101% rise in weekly futures, while BTC and ETH face a downtrend.
See every story in Crypto — including breaking news and analysis.
If Bitcoin fails to rise above the $77,600 resistance zone, it could start another decline. Immediate support is near the $76,750 level.
The first major support is near the $76,500 level. The next support is now near the $75,500 zone. Any more losses might send the price toward the $74,200 support in the near term. The main support now sits at $73,500, below which BTC might struggle to recover in the near term.
Technical indicators:
Hourly MACD – The MACD is now gaining pace in the bearish zone.
Hourly RSI (Relative Strength Index) – The RSI for BTC/USD is now below the 50 level.
Major Support Levels – $76,500, followed by $75,500.
Major Resistance Levels – $77,600 and $78,000.