
Crypto rails are becoming the default payment layer for AI agents, report says
AI agents are using crypto for payments, with $73 million settled on blockchain. Major firms are racing to build the infrastructure.
CoinDesk1 min read

Ethereum's price has recently declined, raising concerns of a correction, but on-chain analysis shows strong long-term investor confidence. Key metrics indicate a significant increase in staked ETH and a healthy market despite the downturn.
Over the past two weeks, the Ethereum price has trended downward, sparking fears of another prolonged correction. However, data from a recent on-chain analysis indicate that the long-term bullish case for Ethereum remains quite strong.
In a recent QuickTake post on CryptoQuant, crypto analyst PelinayPA highlights a confluence of on-chain signals reflecting a strong confidence among Ethereum long-term traders. First, the market analyst notes that the Staked Amount metric, which began to rise in 2023, has reached an all-time high early in 2026. This means the amount of staked ETH has risen significantly, and that a large (and growing) portion of Ethereum’s circulating supply is being removed from active market circulation. In turn, this reduces the amount of ETH available for sale.
At the same time, the MVRV metric signals that the Ethereum market remains healthy, despite recent corrections. PelinayPA explains that while many ETH holders are in profit, the MVRV metric has yet to enter the overheated zones historically reached at cycle tops.

Interestingly, Binance depositor activity has not been rising the same way as the amount of staked ETH. For context, when depositor activity climbs, it is often interpreted as a sign of imminent short-term sell pressure. This is because investors mostly send ETH to Binance in preparation for selling or taking profits. So, while depositor activity has been on the rise, PelinayPA notes that this is inconsequential in the long-term, as staked ETH is climbing steadily and even more aggressively, compared to the amounts recorded in Binance deposits.
Simply put, this means that while short-term players are planning to sell Ethereum, long-term holders are simply taking Ethereum out of circulation and staking it. PelinayPA explains that this kind of divergence often sets the tone for a supply squeeze to play out in the medium to long term. Finally, the crypto analyst reveals that Ethereum’s Realized Cap has also continued to climb. According to the analyst, this reflects that capital is still entering the Ethereum market. Interestingly, PelinayPA points out that this kind of structure is typical of late bull cycles rather than bearish markets.
The recent decline in Ethereum's price has raised concerns about a potential prolonged correction in the market.
The amount of staked Ethereum has reached an all-time high in early 2026, indicating increased long-term investor confidence.
The MVRV metrics suggest that the Ethereum market remains healthy, with many holders in profit and no signs of overheating typically seen at market tops.
AI agents are using crypto for payments, with $73 million settled on blockchain. Major firms are racing to build the infrastructure.
XRP struggles near $1 despite ETF inflows; Bitcoin targets $91K as Dogecoin falls to 10th.

Mark Cuban sells 80% of his Bitcoin, citing market failures during turmoil.
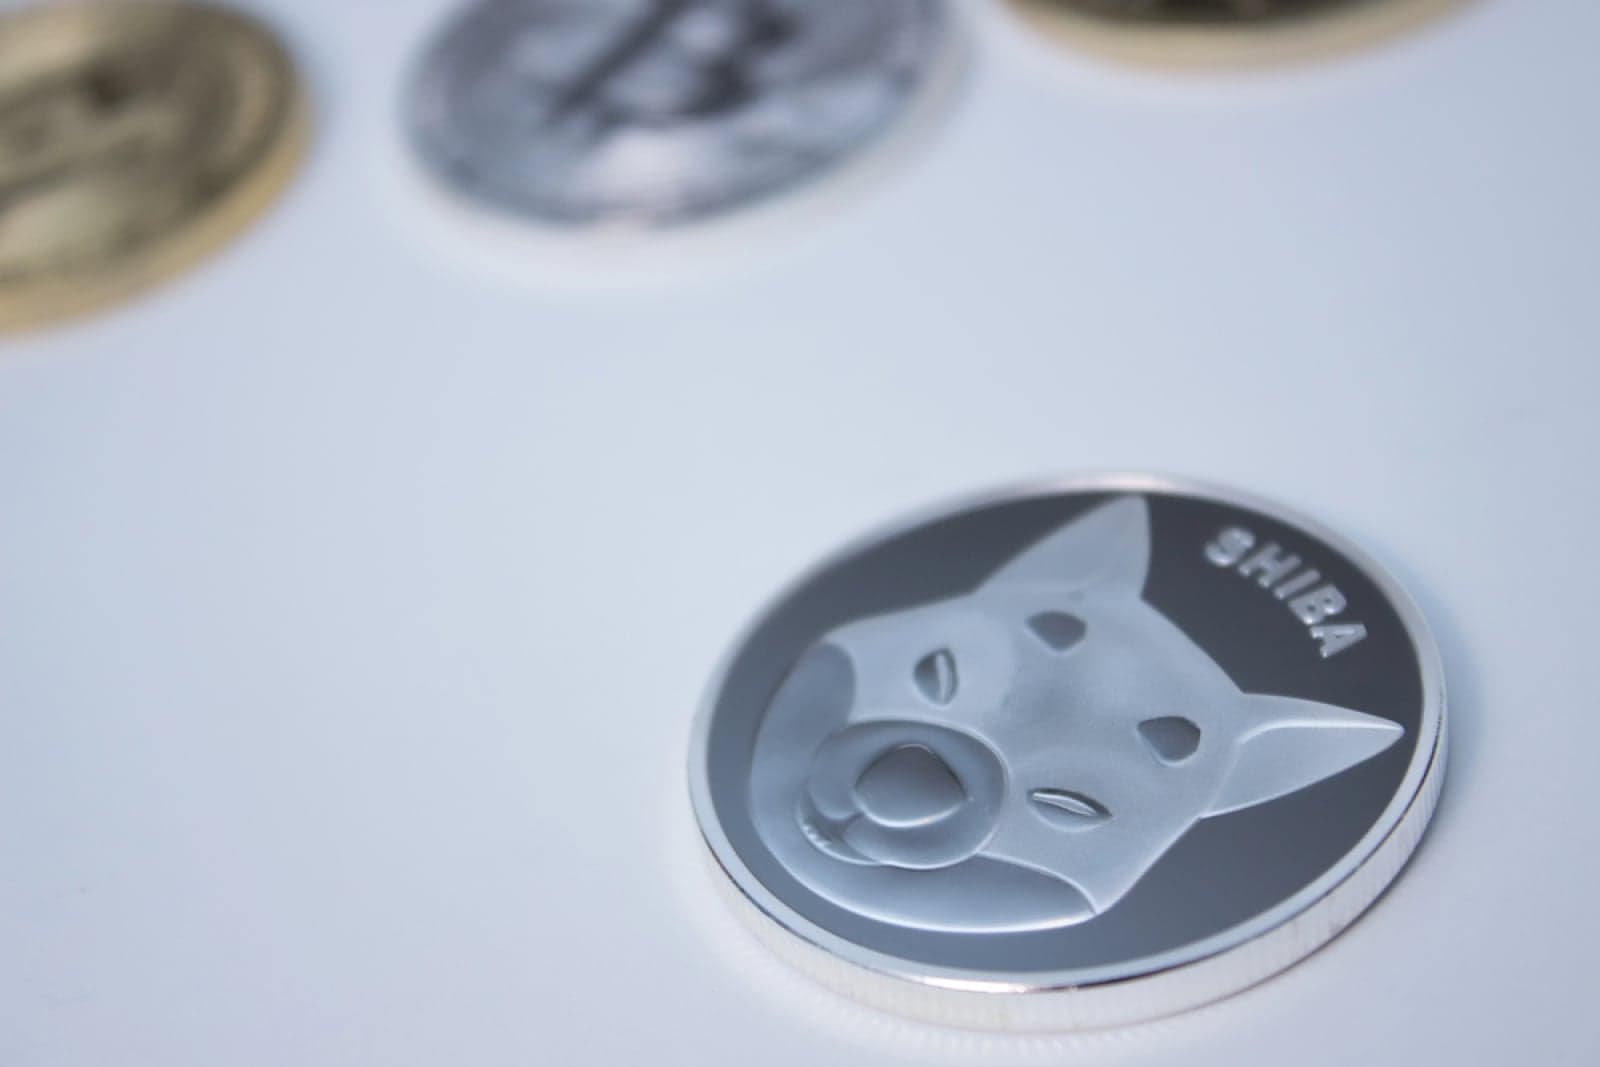
Shiba Inu (SHIB) experiences a sharp increase in exchange outflows as traders move to self-custody.

XRP Ledger sees a mysterious spike of 300,000 new users, raising suspicions.

Cardano's Charles Hoskinson audits 11,000 DAOs to address governance by 2027.
See every story in Crypto — including breaking news and analysis.
Hence, the Ethereum market is currently in a strong bullish trend and may see occasional corrections. According to PelinayPA, when these pullbacks show up, they would likely be buying opportunities, but only if the Binance depositor activity metric has not seen any sudden spikes. As of press time, Ethereum trades for $2,113, reflecting a 2.26% growth over the past day, according to CoinMarketCap data.
ETH trading at $2.127 on the daily chart | Source: ETHSUDT chart on Tradingview.com
Featured image from Pexels, chart from Tradingview