
Ethereum's $3,000 Push Signals Anomalous Shiba Inu (SHIB) Netflow Across Tier-1 Exchanges

TL;DR
Ethereum is nearing a breakout above $2,474, potentially targeting $3,000, which is impacting Shiba Inu's capital flow across tier-1 exchanges.
Key points
- Ethereum is approaching a breakout above $2,474
- Projected target for Ethereum is $3,000
- Shiba Inu is experiencing unusual netflow across tier-1 exchanges
- A symmetrical triangle pattern is forming on Ethereum's chart
- Previous breakouts from similar patterns led to significant gains
The formation of a major technical pattern on Ethereum (ETH) has begun to influence the performance of related highly liquid assets in the ERC-20 ecosystem.
As ETH prepares to break through resistance, the Shiba Inu (SHIB) spot market has recorded an unusual redistribution of capital among major players, confirming the token's status as the main proxy asset of the current market cycle.
A symmetrical triangle has formed on Ethereum's 12-hour chart. According to Ali Martinez's analysis (Ali Charts), the previous breakout from a similar formation drove a 31% gain in three days. A breakout above resistance at $2,474 would put the projected target at $3,000.
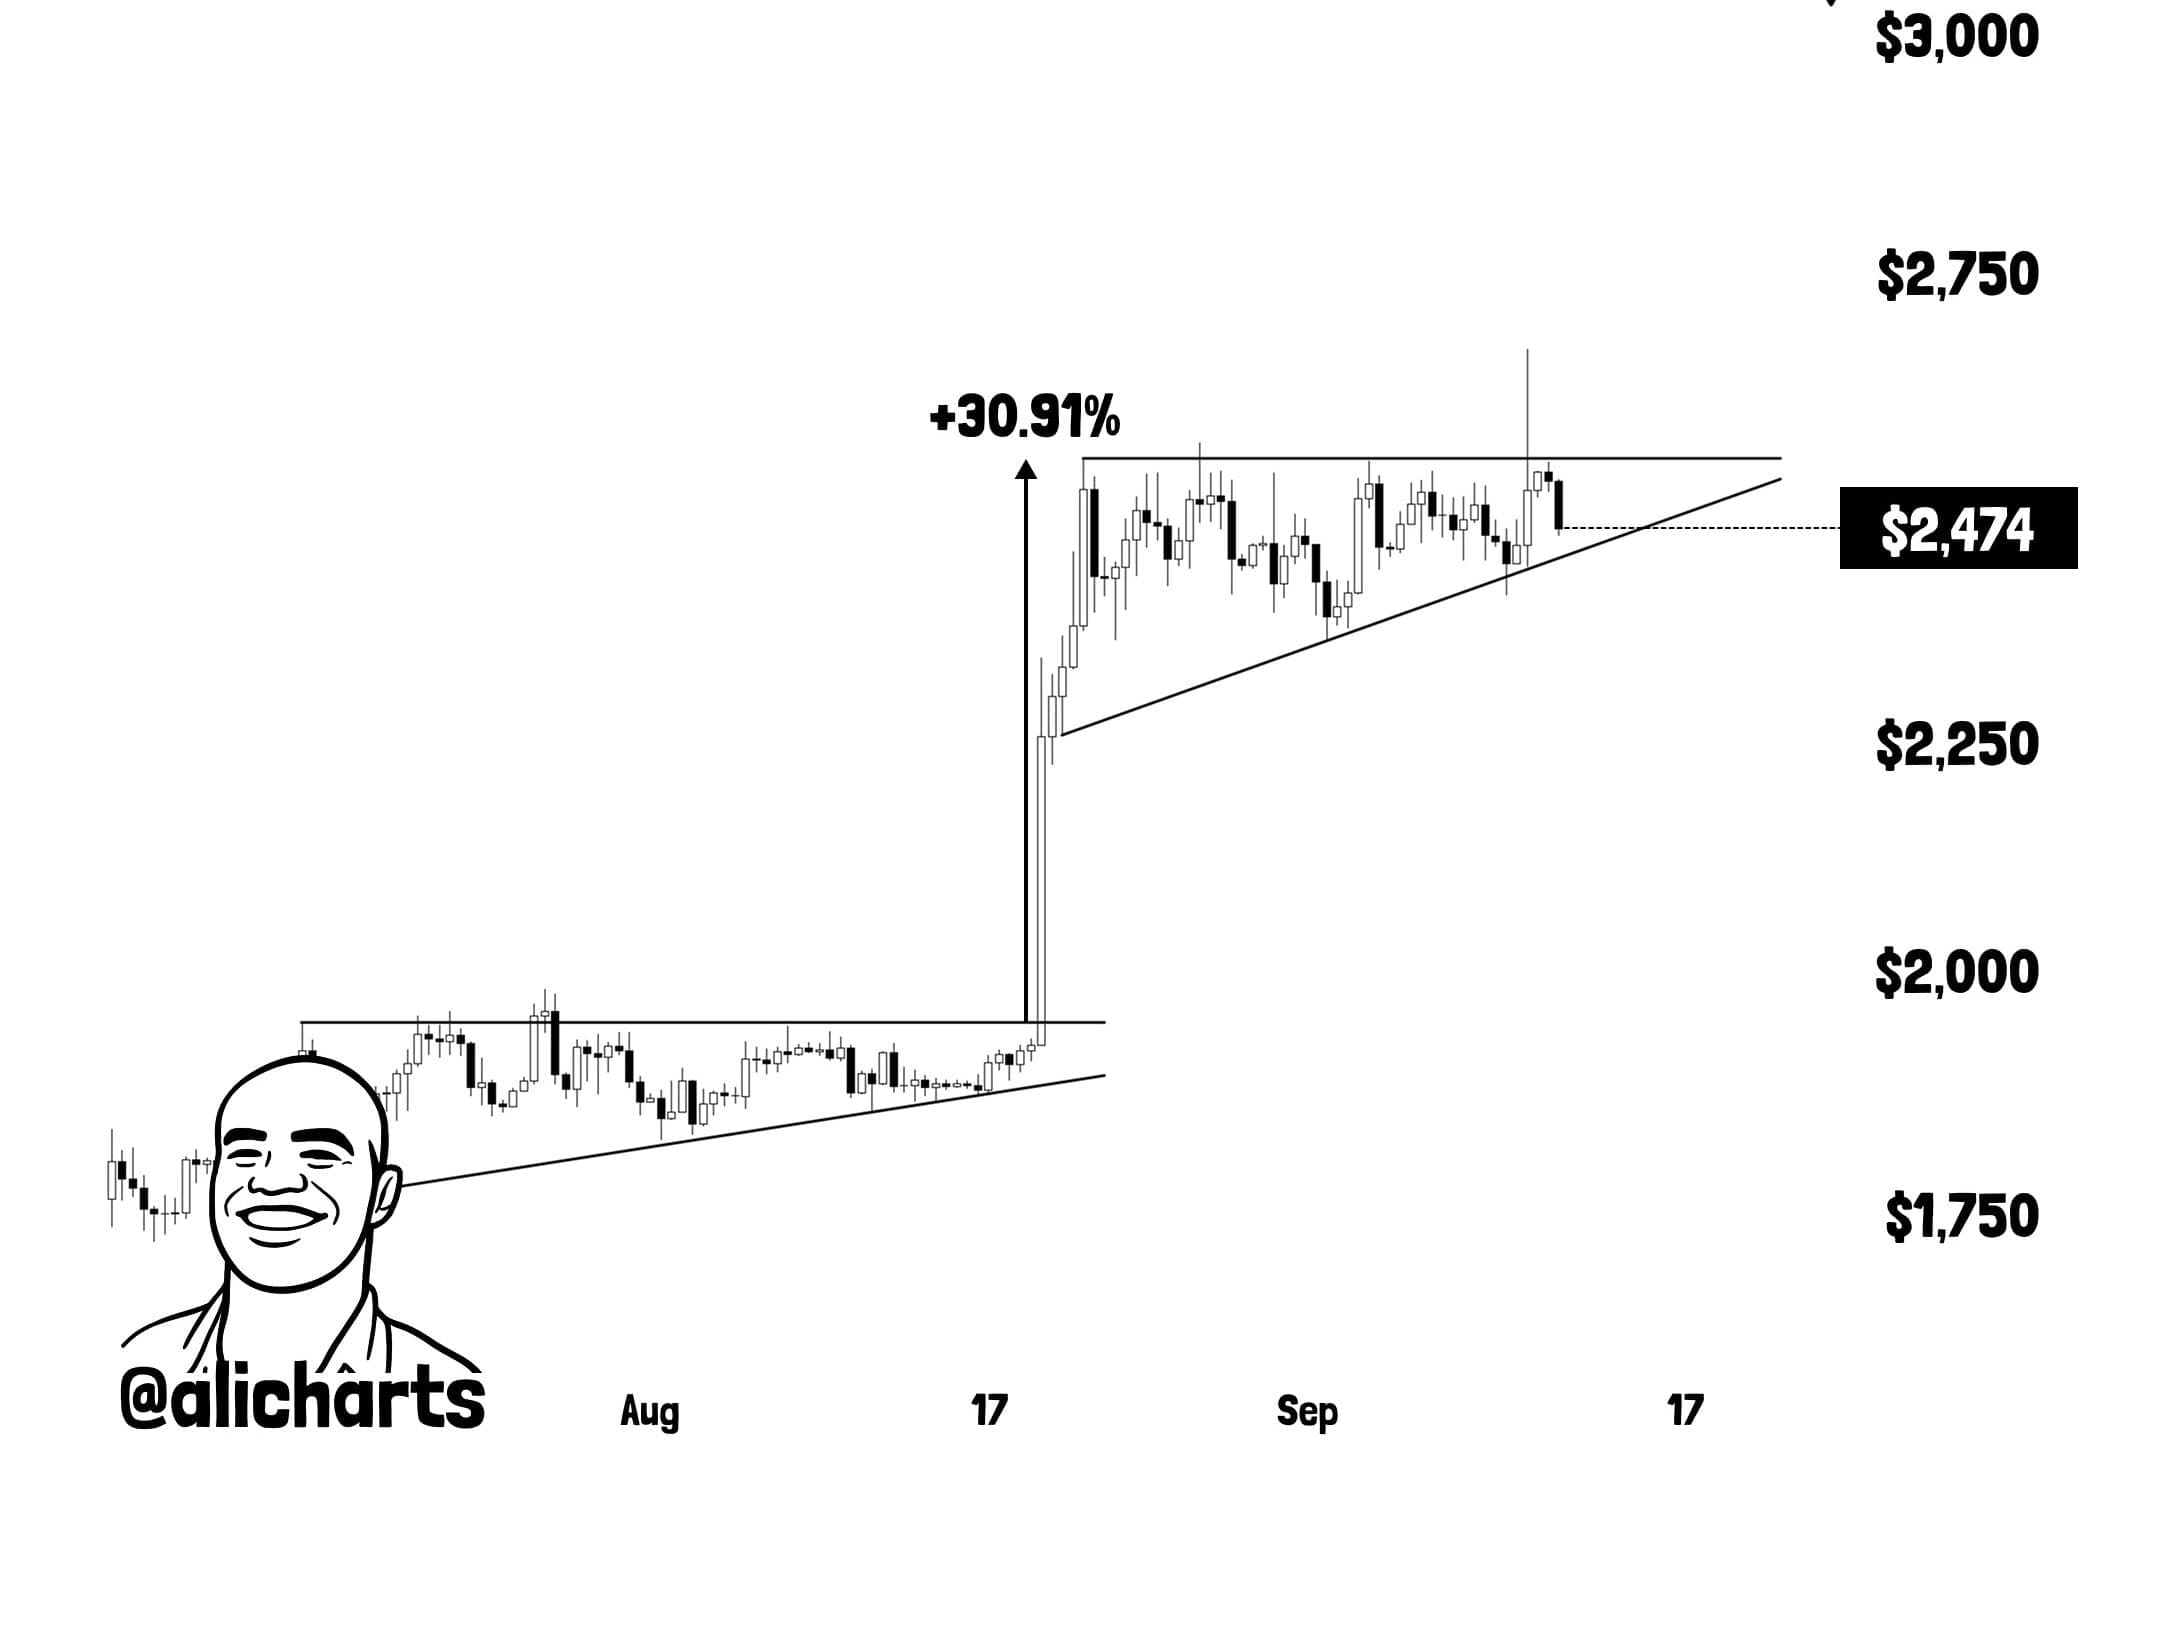
Ethereum 12-hour price chart highlighting a symmetrical triangle pattern near $2,474 with a projected upside target of $3,000. Source: Ali Martinez / X
On-chain statistics support the technical picture: immediately before the pattern formed, large holders withdrew more than $300 million in ETH from exchange addresses to cold wallets. Against the backdrop of declining supply, the coin is holding within the $2,480–$2,510 range after testing an eight-month high of $2,660.
The beta factor: Why Shiba Inu remains the Ethereum ecosystem's main "leverage" asset
On the spot market, SHIB/USD is holding within the $0.00000513–$0.00000527 range, while the relative strength index (RSI) on the daily timeframe stands at a neutral 52.14. As the underlying network builds momentum, daily netflow data from major regulated platforms has recorded structural changes in the token's liquidity as per CoinGlass:
- Capital movements: Net outflows were recorded from spot wallets on Binance (-$122.02K) and Coinbase (-$156.07K), indicating withdrawals for long-term storage. Meanwhile, OKX (+$199.48K) and Bybit (+$93.82K) recorded net inflows.
- Trading volumes: The bulk of spot liquidity remained concentrated on Binance ($2.31M), while daily trading volume on Bybit fell 64.49% to $603.10K.
Shiba Inu's historically high liquidity within the ERC-20 ecosystem makes the token a natural "leverage" asset when traders take profits from Ethereum's price movements.
Q&A
What is the significance of Ethereum reaching $3,000?
Reaching $3,000 would indicate a strong bullish trend for Ethereum, potentially influencing the entire ERC-20 ecosystem.
How has Shiba Inu's netflow changed in response to Ethereum's price movements?
Shiba Inu has experienced unusual capital redistribution among major players, confirming its role as a proxy asset in the current market cycle.
What technical pattern is forming on Ethereum's chart?
A symmetrical triangle pattern is forming on Ethereum's 12-hour chart, which historically has led to significant price movements.