Last Time XRP Was 'Anti-Volatile' Like This, It Went on a 240-Day Sideways Drift
TL;DR
XRP's price has dropped to $1.34–$1.37, with volatility nearly absent. Historically, this 'anti-volatility' state leads to a sideways drift lasting up to 240 days.
Key points
- XRP's price has fallen to $1.34–$1.37
- Volatility has nearly disappeared, indicating a pause in the market
- Previous patterns show a potential 240-day sideways drift after such conditions
XRP's brief August surge has officially faded. The coin's price has slipped to $1.34–$1.37, while volatility on the daily chart has almost completely vanished: the Bollinger Bands have tightened into a narrow horizontal line, according to TradingView data. Historically, this state of "anti-volatility" has meant only one thing for XRP: the market is hitting pause.
Previous cycles show that after such a lull, the asset typically falls into a sluggish sideways drift, which can last as long as 240 days.
Short cycle or deep flat: How many days will XRP remain in sideways drift?
The market has not frozen without reason. Major players and speculators are openly reluctant to open positions ahead of next week, which could reshape the macroeconomic landscape.
First, the U.S. Senate will vote on the CLARITY Act on Sept. 15. The bill stalled throughout the summer, prompting institutions to freeze their activity, while inflows into XRP ETFs plunged by 93%.
Second, the Federal Reserve will announce its interest rate decision on Sept. 16. Inflation in the U.S. is mounting again, with PPI jumping to 5.4%, while Brent crude has surged above $107. The market is pricing in a hawkish outcome from the central bank with a 70% probability, so major capital is simply fleeing into the safety of cash.
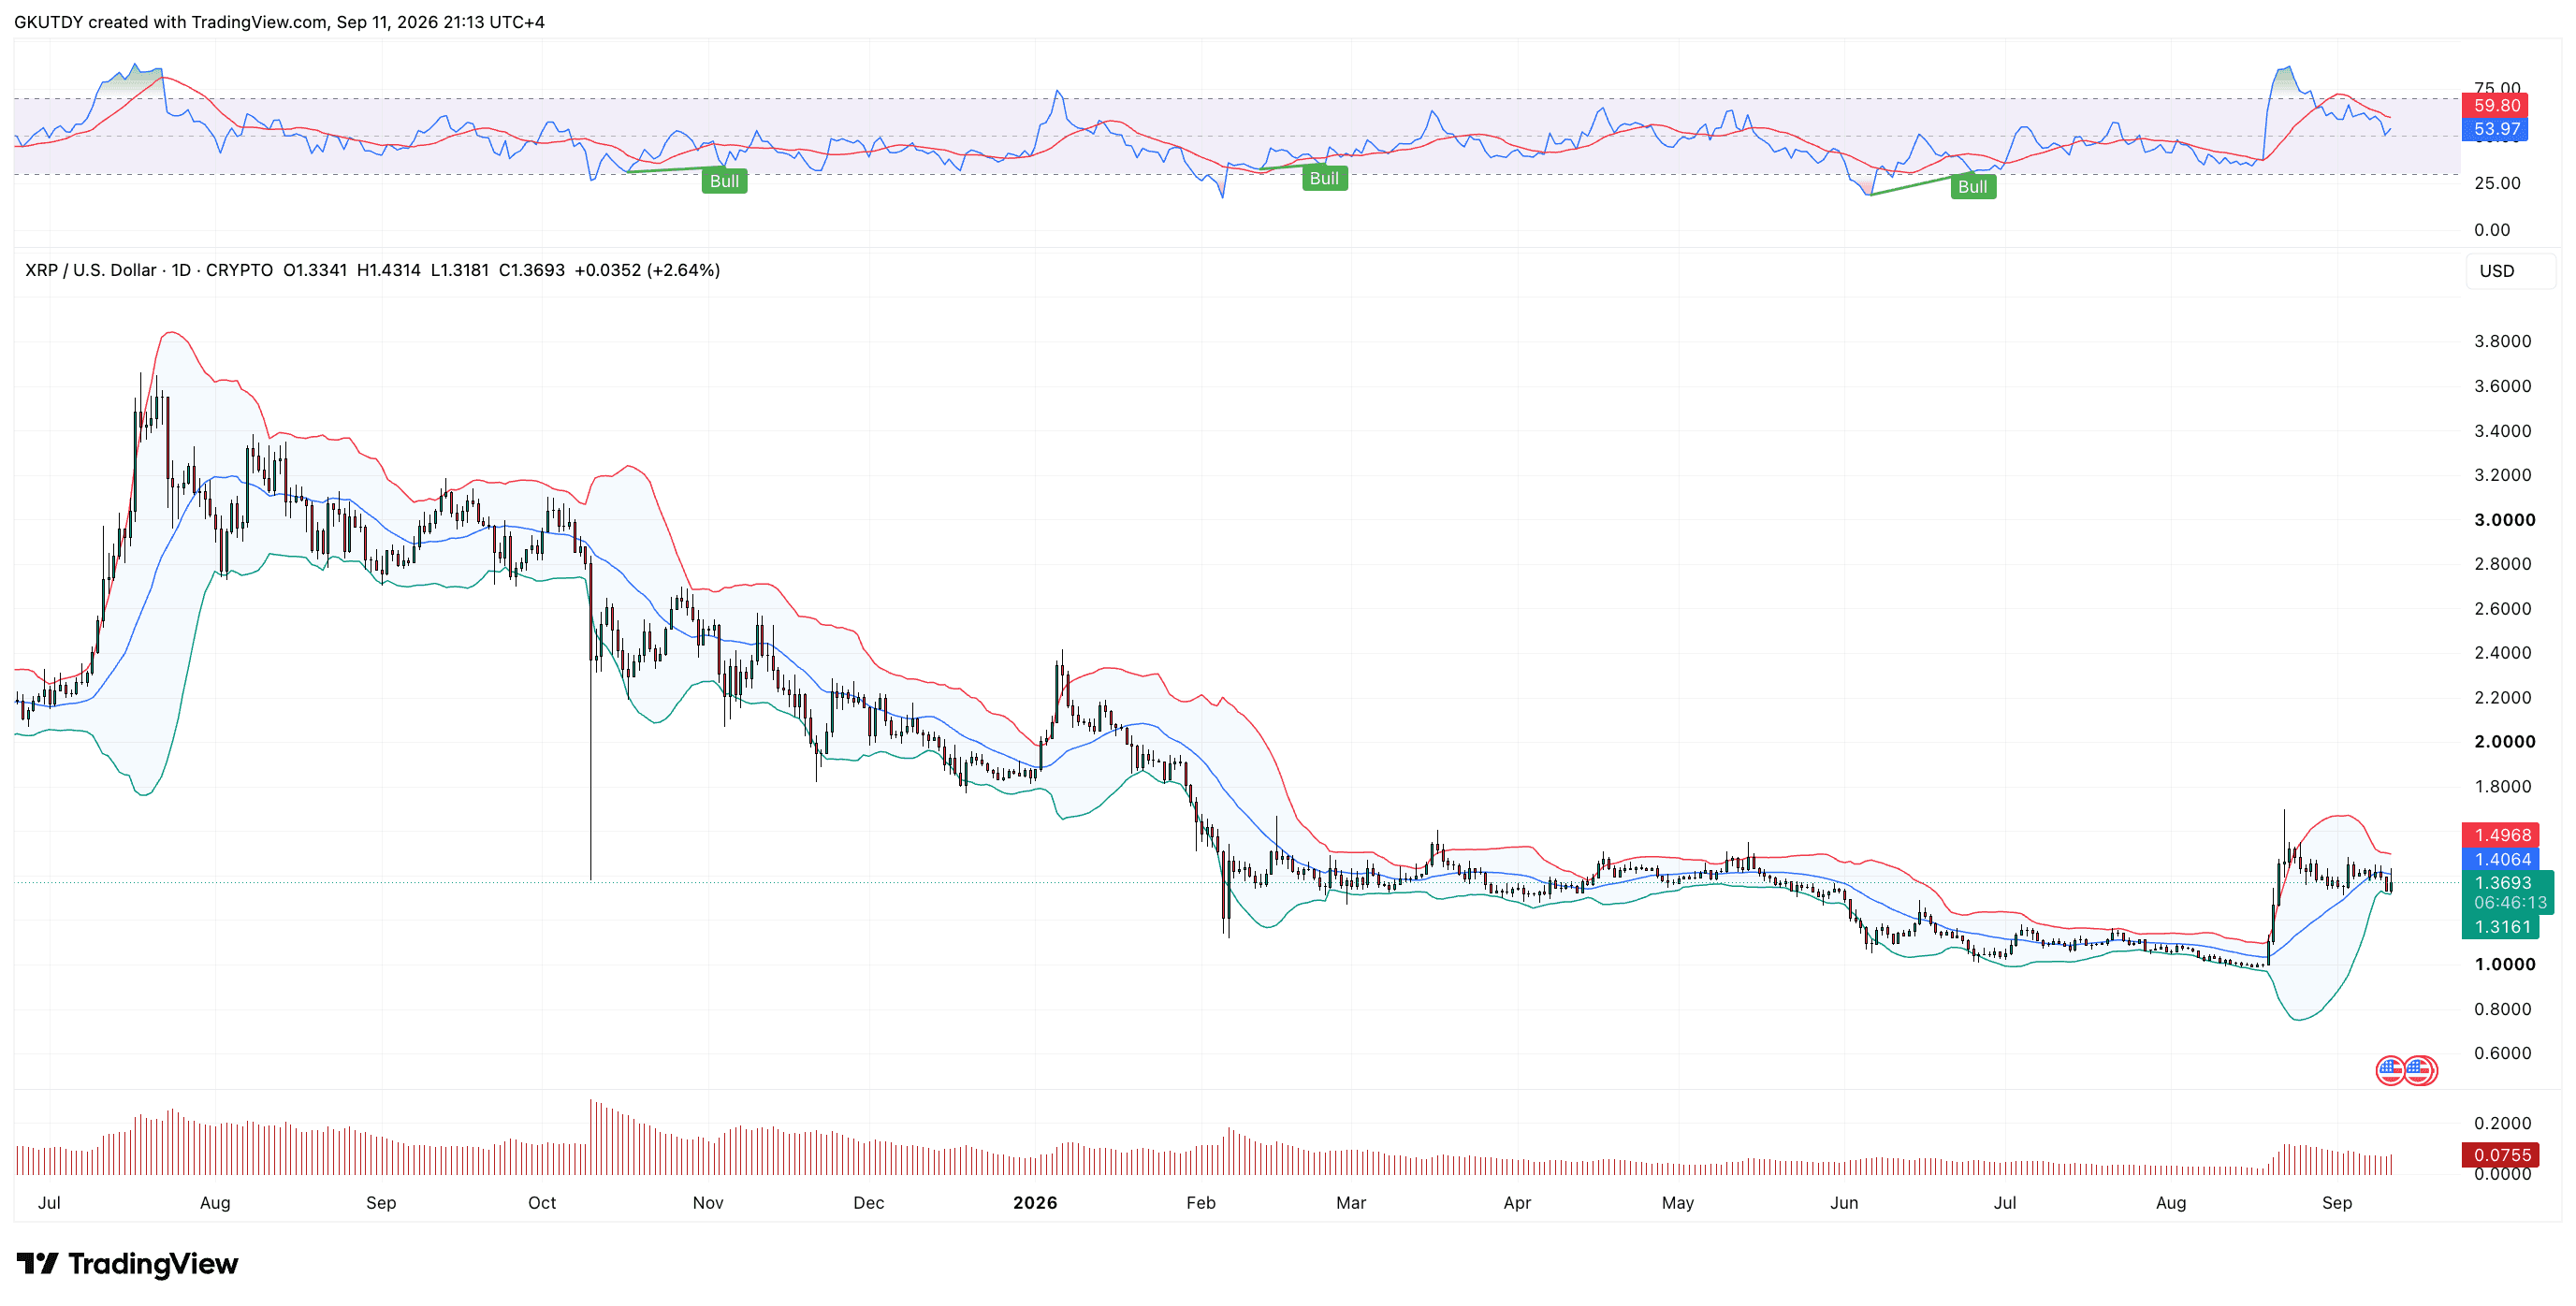
XRP/USD daily chart showing Bollinger Bands squeeze and declining volatility, Source: TradingView
Under this pressure, XRP is being protected from a deeper decline by a sharp shift in holder sentiment. According to analytics platform CryptoQuant, the peak inflow of coins onto exchanges on Sept. 9 was followed by a rapid outflow. In just one day, XRP reserves on Binance alone fell to 2.631 billion tokens.
The price drop to a local low of $1.33 forced traders to stop selling and begin withdrawing their assets from trading platforms while awaiting the upcoming news.
Looking at the raw numbers from XRP's previous accumulation periods, the market has two clear time frames:
- Short cycle (79–89 days): This is how long the coin accumulated strength during the previous local cycles of 2025. If the scenario repeats, the chart will not "wake up" until late November or early December 2026.
- Macro cycle (up to 240 days): This is almost exactly how long the previous exhausting sideways period lasted before the Aug. 31 breakout: nearly eight months, or 236 days. In the worst-case scenario, XRP will not emerge from its current consolidation until spring 2027.
The timer for a new prolonged flat has already started. Its actual duration will be determined by the Senate vote and the Federal Reserve's decision over the next few days.
Q&A
What does XRP's current 'anti-volatility' state indicate?
XRP's 'anti-volatility' suggests that the market is pausing, often leading to a prolonged sideways drift in price.
How long can XRP's sideways drift last based on past cycles?
Historically, XRP's sideways drift can last as long as 240 days following a period of low volatility.
What upcoming events could affect XRP's price movement?
The U.S. Senate's vote on the CLARITY Act on September 15 could significantly impact XRP's market activity.