Ripple Price Analysis: XRP Reaches Decision Point After Weeks of Consolidation
TL;DR
Ripple's XRP is trading around the $1.3 support zone after weeks of consolidation, facing resistance at $1.4-$1.45. A decisive move is expected soon as it approaches a critical technical region.
Key points
- XRP is trading around the $1.3 support zone
- Resistance levels are between $1.4 and $1.45
- Recent recovery attempts lack bullish momentum
- A bearish rejection is likely at the resistance zone
- A breakout above the descending channel could signal a rally
Mentioned in this story
Ripple’s XRP has continued trading within a broader bearish market structure despite the recent stabilization around the $1.3 key support zone. While short-term volatility has declined in recent weeks, the asset is now approaching a decisive technical region where the next major directional move could soon emerge.
Ripple Price Analysis: The Daily Chart
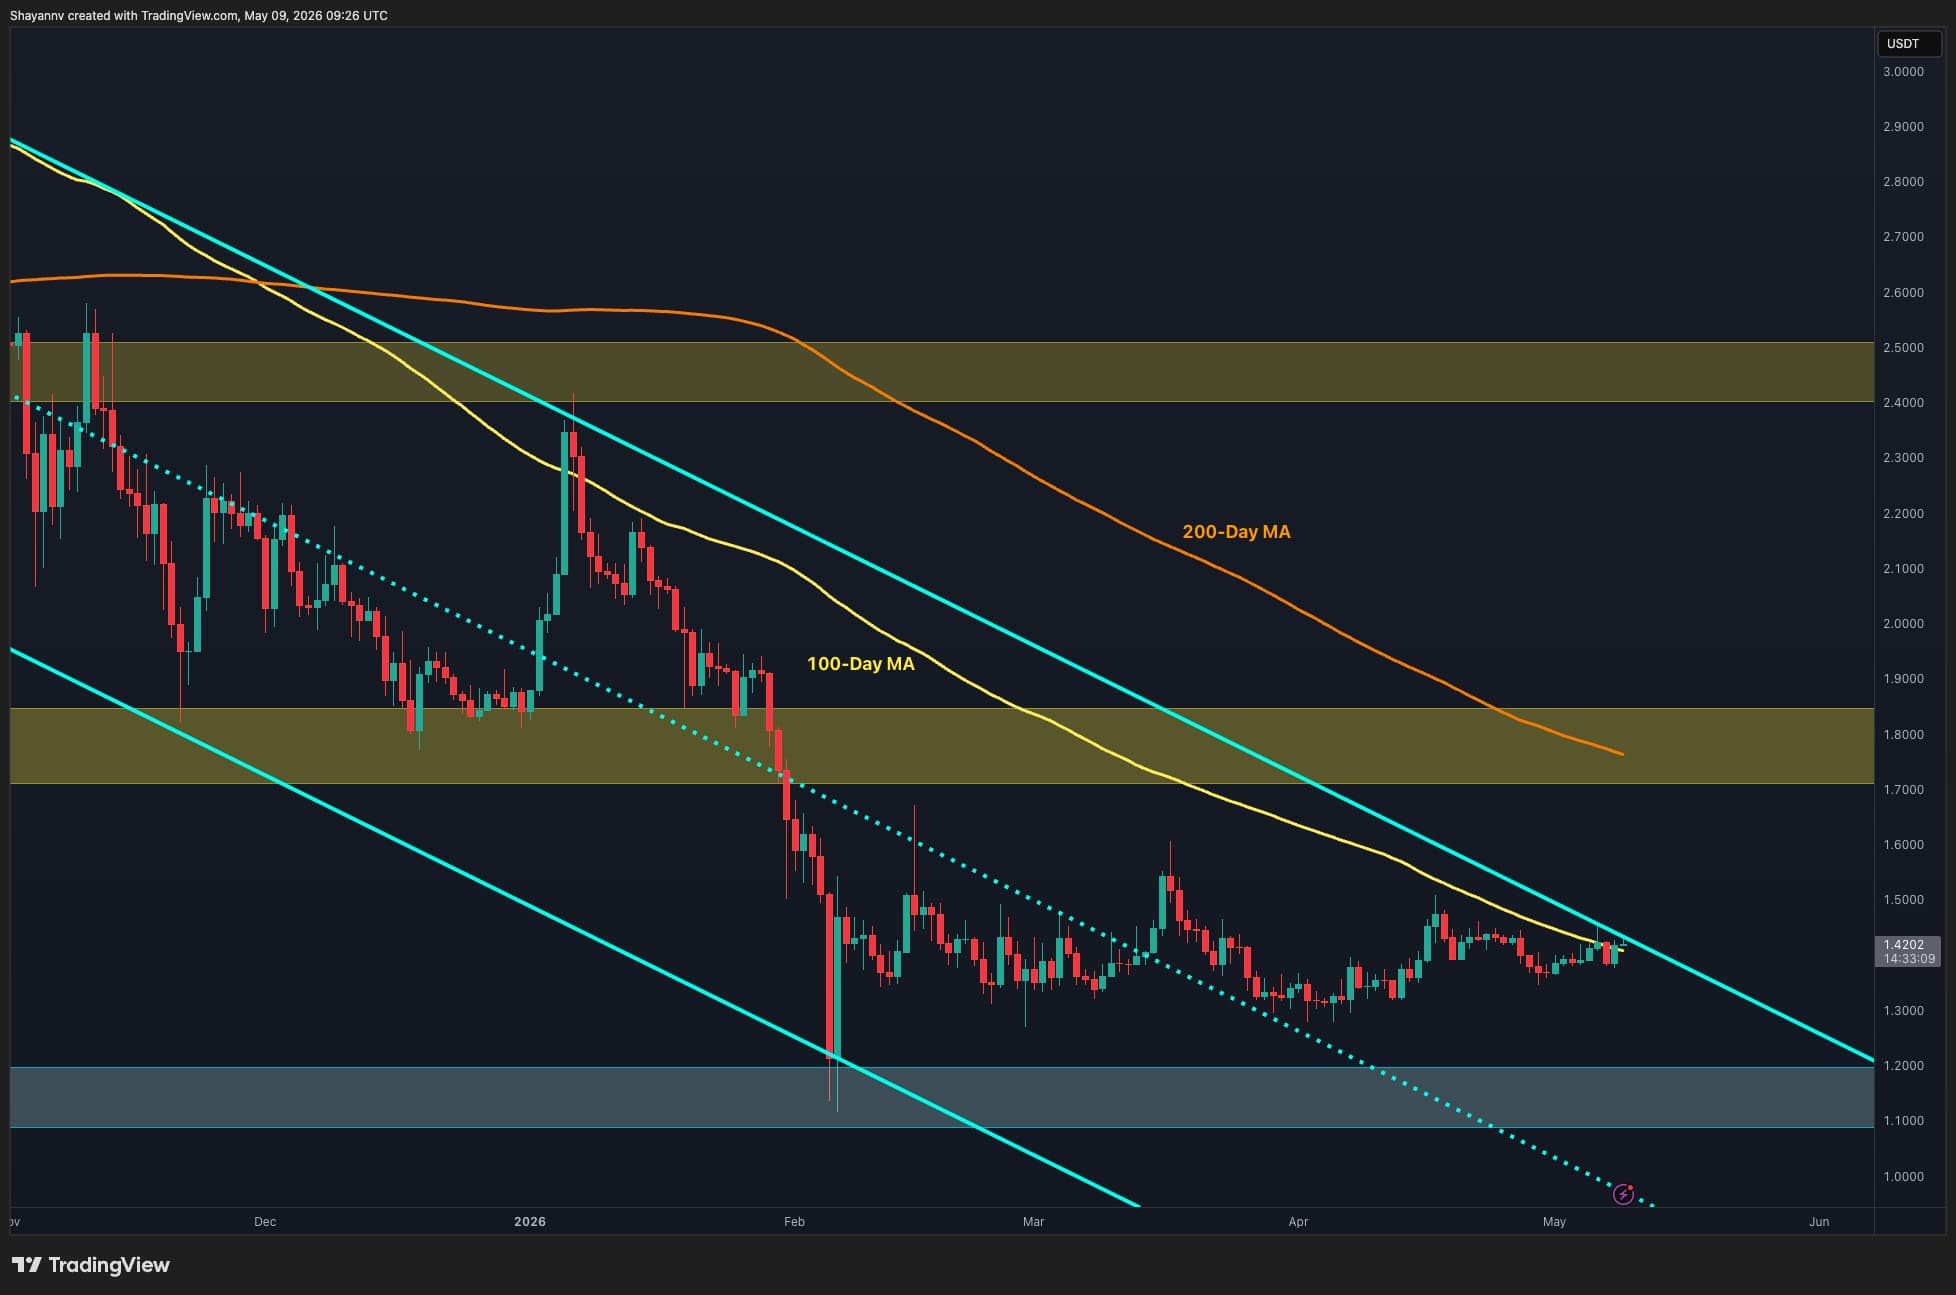
On the daily timeframe, XRP is currently facing a strong confluence of resistance levels around the $1.4-$1.45 region. This area includes the 100-day moving average, positioned near $1.4 and aligned with the upper boundary of the long-term descending channel. Such a technical confluence significantly strengthens the importance of this resistance zone and increases the probability of a bearish rejection due to growing seller presence.
The recent recovery attempts have so far lacked sufficient bullish momentum, and failure to reclaim this region could trigger another pullback toward lower support levels around the $1.3 and $1.2 areas. From a broader perspective, only a valid bullish breakout above the descending blue channel on higher timeframes would invalidate the ongoing bearish structure and potentially initiate a sustained bullish rally toward higher resistance zones.

XRP/USDT 4-Hour Chart
On the 4-hour chart, XRP has entered a prolonged consolidation phase, forming a symmetrical triangle pattern. This structure reflects a temporary equilibrium between buyers and sellers, with neither side currently holding a decisive advantage. Typically, such formations lead to strong directional moves once a breakout eventually occurs.
The price has now reached the narrowest section of the triangle around the $1.4-$1.45 range, suggesting that a breakout scenario could unfold in the near term. A bullish breakout above the upper trendline may open the path toward higher resistance regions, while a bearish breakdown below the lower boundary would likely accelerate downside pressure and continue the broader bearish trend.

Q&A
What is the current price resistance level for Ripple's XRP?
Ripple's XRP is facing strong resistance between $1.4 and $1.45, including the 100-day moving average.
What could happen if XRP fails to break above the $1.4 resistance?
If XRP fails to reclaim the $1.4 resistance, it could trigger a pullback toward lower support levels around $1.3 and $1.2.
What indicates a potential bullish breakout for XRP?
A valid bullish breakout above the descending channel on higher timeframes would invalidate the current bearish structure and may lead to a sustained rally.