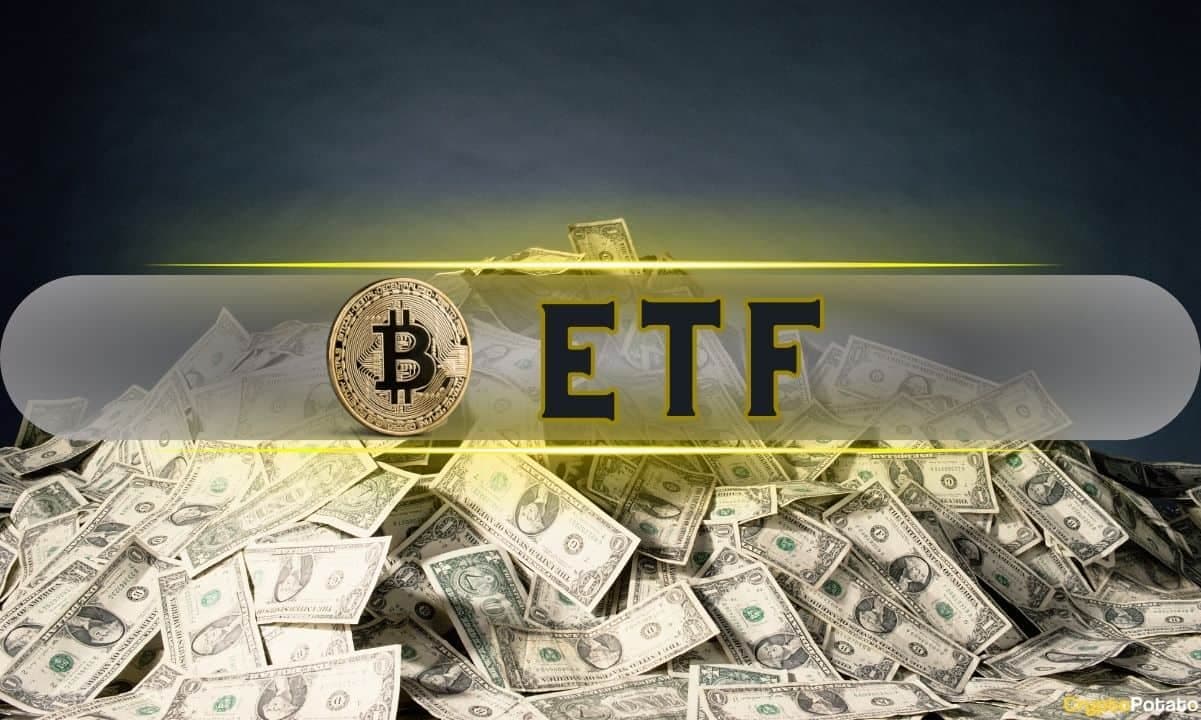
Ripple's 'North Star' XRP Doubles ETF Inflows Amid Tokenization Breakthrough; SHIB Decouples From Dogecoin; Bitcoin Eyes $94,500 as 'Sell in May' Trigger: Bollinger Bands - Morning Crypto Report

TL;DR
XRP ETF inflows doubled to $34.21 million after a tokenization test by JPMorgan, Mastercard, and Ripple. Shiba Inu has decoupled from Dogecoin, while Bitcoin targets $94,533 amid market volatility ahead of U.S. CPI data.
Key points
- XRP ETF inflows doubled to $34.21 million
- Shiba Inu decouples from Dogecoin
- Bitcoin targets $94,533
- Market volatility expected ahead of U.S. CPI data
- Tokenization test involved JPMorgan, Mastercard, and Ripple
Mentioned in this story
TL;DR
- XRP Surge: Weekly institutional spot XRP ETF inflows double to $34.21 million following a landmark 5-second cross-bank tokenization test by JPMorgan, Mastercard, and Ripple.
- Memecoin Divergence: Shiba Inu coin completely decouples from Dogecoin's 8% price collapse, consolidating on heavy volume amid high-profile multi-asset ETF integration expectations.
- Bitcoin Breakout Target: BTC invalidates seasonal "Sell in May" weakness, securing a bullish weekly Bollinger Band position that puts a technical target of $94,533 in play.
- Crypto Market Outlook: Digital asset markets brace for volatility heading into Tuesday's upcoming U.S. CPI data release and the Senate's final review of the CLARITY Act.
How JPMorgan and Mastercard's XRPL test brought millions into XRP ETFs
Weekly net inflows into U.S. spot XRP ETFs more than doubled, according to SoSoValue, surging to $34.21 million for the reporting week ending May 8. The institutional trigger may have been a historic breakthrough in the real-world asset (RWA) tokenization sector on the XRP Ledger blockchain.
The direct catalyst behind the capital inflows was the first-ever cross-platform redemption of tokenized U.S. Treasuries - the OUSG fund by Ondo Finance - between banks in 24/7 mode within five seconds. The settlement chain involved Kinexys by JPMorgan Chase, Mastercard, and infrastructure from Ripple.

Total XRP Spot ETF Net Inflow from April 26 to May 10, Source: SoSoValue
Against this backdrop, as Santiment reported, retail speculators fueled hype around the ONDO token (+17.9%), while the exchange price of XRP itself remained "flat" at $1.39.
However, by the end of the week, it became clear that regulated funds had started aggressively accumulating ETF shares, pushing cumulative inflows to $1.32 billion. The rise of XRP ETF net assets to $1.12 billion proved that large capital is ignoring exchange noise and entering XRP directly, indirectly reinforcing Ripple's thesis that XRPL is the "North Star" of interbank tokenization.
Why has the Shiba Inu coin stopped falling alongside Dogecoin?
A clear divergence in trend strength has emerged across the memecoin market. Dogecoin, according to the daily DOGE/USDT chart from May 10, 2026, fell 8% over the past five days, correcting to $0.10820. The TradingView chart clearly shows strong bearish impulse, with price rapidly collapsing below the long-term MA 200 moving average (red line at $0.12231) and breaking under local moving averages.
Meanwhile, the Shiba Inu coin is showing completely different, isolated dynamics. Unlike DOGE, SHIB has become tightly compressed within a narrow price corridor around $0.00000645.
Technical accumulation instead of capitulation: While DOGE continues printing new May lows, SHIB is holding a dense horizontal volume zone (VRVP) and refusing to let sellers push the local bottom lower.

SHIB and DOGE price action in the past week, Source: TradingView
Buyers in SHIB are maintaining the Relative Strength Index in a neutral-to-bullish zone, while Dogecoin's RSI (59.59 on the chart) continues drifting lower together with price.
Fundamental barrier: While speculative capital is exiting inflationary DOGE after April's hype cycle, SHIB is being supported by institutional background — particularly expectations surrounding integration into multi-asset spot ETFs, including products linked to T. Rowe Price and Coinbase 50.
If DOGE risks falling toward the next major support block at $0.09764, SHIB's setup is the opposite. Through narrow consolidation, the token is storing energy. A breakout above the nearest psychological resistance at $0.00000700 would open the path toward an impulsive rebound, finally cementing the coin's status as an asset independent of DOGE.
Bitcoin vs. the "sell in May" rule: Bollinger Bands open the road to $94,500
While the market debates whether the old Wall Street rule "Sell in May and Go Away" will work in 2026, Bitcoin's technical indicators on the weekly chart by TradingView have started signaling the exact opposite scenario. The leading cryptocurrency has secured a position above the key middle line of the Bollinger Bands on the weekly chart, reversing a prolonged period of historically low volatility in favor of buyers.
Successful defense of the middle band confirms that initiative has moved to the bulls. This level is now acting as strong local support. At the same time, the upper Bollinger Band for Bitcoin is currently positioned at exactly $94,533.

Bitcoin weekly chart with Bollinger Bands, Source: TradingView
In the absence of strong resistance, this technical target appears to be the most realistic scenario for May. Meanwhile, the lower band has moved toward $57,868 per BTC, marking a strong long-term defensive level for the market.
Particular interest in the current technical setup is being fueled by the fact that the creator of the indicator himself, legendary trader John Bollinger, has identified a trend reversal. His automated Bitcoin trading model has entered "positive" territory, while the Tactica investment program has opened long positions.
So far, instead of seasonal weakness, the market is displaying controlled accumulation for a test of the upper boundaries of the current trading range.
Crypto market outlook: Bitcoin price, Clarity Act, and CPI
While Bitcoin consolidates above the $80,000 level amid accelerating legislative activity in Washington, expectations surrounding fresh U.S. inflation data are keeping long-term investor positioning under intense pressure, narrowing the market's trading range heading into the middle of the week.
Key checkpoints:
- Bitcoin price outlook: At the moment, BTC is trading at $80,735 (+0.12% over the past 24 hours), stabilizing strictly within a short-term bullish trendline. A successful breakout above the key psychological resistance at $82,800 would open the technical path toward $91,000, while strong structural dynamic support remains untouched near $77,300.
- May 12 macro trigger: Investor focus is centered on Tuesday's U.S. Consumer Price Index (CPI) release. Cooling inflation figures would strengthen market expectations that the Federal Reserve could begin a monetary easing cycle later this year, potentially pushing BTC toward $85,000. Conversely, an excessively "hot" report would trigger an aggressive downside squeeze aimed at liquidating overheated leveraged long positions.
- Legislative battle around the CLARITY Act: Global digital asset markets are focused on the U.S. Senate Banking Committee, which this week moves toward final review of the structural crypto bill known as the CLARITY Act. On one side stand traditional banks opposing decentralized stablecoin yield models, and on the other stands a potential catalyst for decentralized finance (DeFi) and institutional liquidity inflows throughout the remainder of 2026.
Q&A
What caused XRP ETF inflows to double?
XRP ETF inflows doubled to $34.21 million due to a landmark tokenization test involving JPMorgan, Mastercard, and Ripple.
How did Shiba Inu decouple from Dogecoin?
Shiba Inu decoupled from Dogecoin amid heavy trading volume and expectations for multi-asset ETF integrations.
What is Bitcoin's target price amid market changes?
Bitcoin is targeting a price of $94,533 as it invalidates the seasonal 'Sell in May' trend.
What upcoming events could impact the crypto market?
The crypto market is bracing for volatility due to the upcoming U.S. CPI data release and the Senate's review of the CLARITY Act.