
Solana Price Structure Suggests Temporary Recovery Before Next Major Decision
Solana's price structure hints at a possible temporary recovery before a major market decision.
NewsBTC1 min read

Solana's price has declined below $86 and is currently consolidating above $82. A recovery may occur if bulls defend the $83 or $82.50 levels.
Solana failed to settle above $86 and corrected most gains. SOL price is now consolidating losses above $82 and might attempt another increase.
Solana price failed to remain stable above $88 and started a fresh decline, like Bitcoin and Ethereum. SOL declined below the $86 and $85 levels.
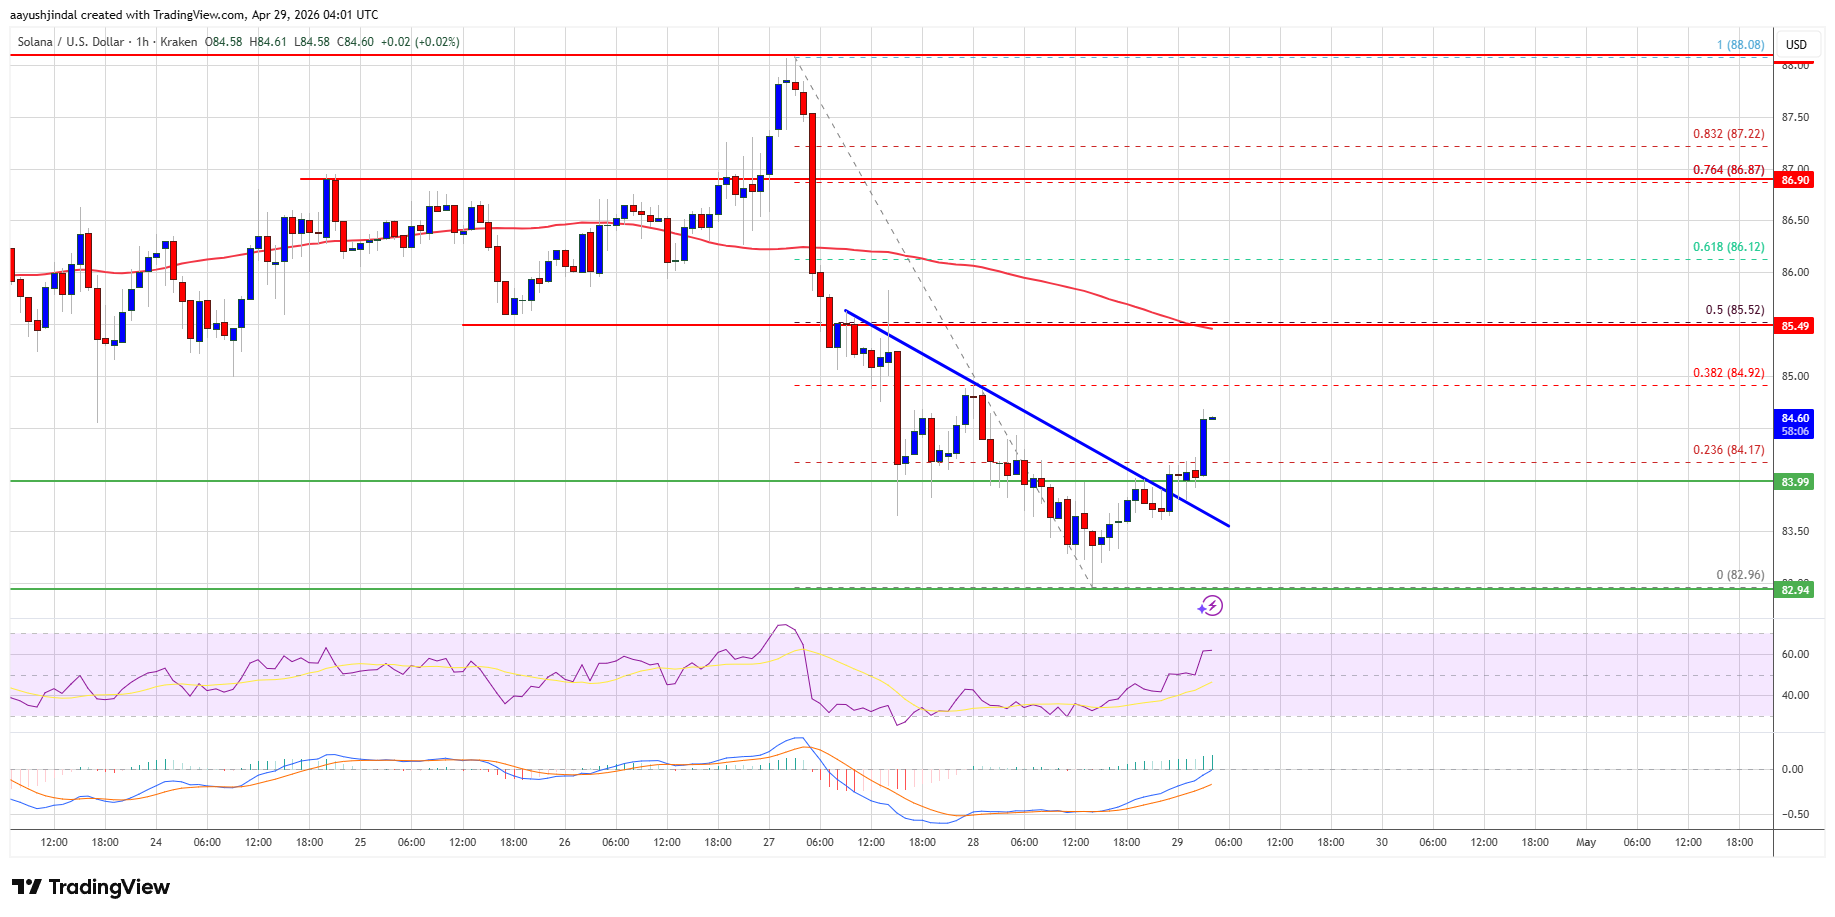
The bears even pushed the price toward $83. A low was formed at $82.96, and the price is now consolidating losses. There was a minor recovery wave above the 23.6% Fib retracement level of the downward move from the $88.08 swing high to the $82.96 low.
Besides, there was a break above a connecting bearish trend line with resistance at $84 on the hourly chart of the SOL/USD pair. Solana is now trading near $85 and the 100-hourly simple moving average.
Source: SOLUSD on TradingView.com
On the upside, immediate resistance is near the $85.50 level or the 50% Fib retracement level of the downward move from the $88.08 swing high to the $82.96 low. The next major resistance is near the $86.80 level. The main resistance could be $88. A successful close above the $88 resistance zone could set the pace for another steady increase. The next key resistance is $90. Any more gains might send the price toward the $92 level.
If SOL fails to rise above the $85.50 resistance, it could continue to move down. Initial support on the downside is near the $83.50 zone. The first major support is near the $83 level.
Solana's price declined due to failure to maintain stability above $88, leading to a drop below key support levels.
The critical support levels for Solana are $83.00 and $82.50, which bulls need to defend to initiate a potential recovery.
Solana's price movement mirrors that of Bitcoin and Ethereum, which also experienced declines after failing to hold key resistance levels.
Solana's price structure hints at a possible temporary recovery before a major market decision.

Bitcoin traders are coming back after an eight-month deleveraging phase, signaling renewed risk appetite.

Bitcoin Price Analysis for May 23: Bearish Sentiment Continues as Key Levels Hold

FET's exchange supply is vanishing; traders are on alert.

Is Chainlink (LINK) on track to triple in value and hit a $20B market cap in 5 years?

Crypto expert warns Ethereum could plummet to $800 or $400.
See every story in Crypto — including breaking news and analysis.
A break below the $83 level might send the price toward the $80 support zone. If there is a close below the $80 support, the price could decline toward the $75 support in the near term.
Technical Indicators
Hourly MACD – The MACD for SOL/USD is gaining pace in the bullish zone.
Hourly Hours RSI (Relative Strength Index) – The RSI for SOL/USD is above the 50 level.
Major Support Levels – $84.00 and $82.00.
Major Resistance Levels – $85.50 and $88.00.