
1 Major Reason Cardano Creator Audits 11,000 DAOs Is Governance
Cardano's Charles Hoskinson audits 11,000 DAOs to address governance by 2027.
U.Today1 min read

Shiba Inu (SHIB) is currently trading around $0.0000058-$0.0000060, showing weak momentum and likely to fall further. The token's previous attempts to recover were met with selling pressure, indicating a lack of sustained interest.
Weak momentum, compression and indecision following a protracted downtrend are exactly what the market data has been indicating for months, and Shiba Inu is most likely to fall from the edge here.
The token briefly moved toward the $0.000008-0.000009 zone earlier in 2026, but those moves lacked follow-through and were swiftly sold into. This is the main problem: every rally is being treated as exit liquidity.
Currently trading around $0.0000058-$0.0000060, SHIB has drifted back toward its lower range after failing to sustain earlier recovery attempts. Technically speaking, there is no verified trend reversal, and SHIB is trapped below major moving averages.

SHIB/USDT Chart by TradingView
The overall structure is in line with what many analysts anticipate: a consolidation phase between roughly $0.000006 and $0.000010, not a breakout trend. Indicators are neutral to slightly bearish, with the RSI hovering around midrange levels and no strong bullish divergence.
The true question now is whether it will sink again. In a nutshell, it can, and the setup permits it. The critical level is between $0.0000058 and $0.0000059. This is functioning as a weak support.
According to current projections, if that breaks with volume, downside targets open toward $0.0000052 or lower. Given the weak demand and decreasing burn activity, there is nothing structurally stopping that move.
However, it is also not a certain collapse. Reduced selling pressure and sporadic accumulation by larger holders are indicators of stabilization. SHIB may enter a short-term recovery phase if it can recover and hold above $0.0000065.
Investors should expect ongoing chop within a range rather than a clear trend. SHIB is evolving into a liquidity-driven alt coin that tracks general market sentiment rather than acting like a high-beta meme coin.
Shiba Inu (SHIB) is currently trading between $0.0000058 and $0.0000060.
SHIB is facing weak momentum due to a protracted downtrend and selling pressure during recovery attempts.
The lack of a verified trend reversal means SHIB is likely to remain under pressure and may continue to decline.
The market has treated every rally in SHIB as exit liquidity, leading to quick sell-offs and a lack of sustained interest.
Cardano's Charles Hoskinson audits 11,000 DAOs to address governance by 2027.
Bitcoin rebounds to over $74K as total crypto market cap rises by $80 billion.

Wietse Wind warns XRP community about rising scams targeting Xaman wallet users.
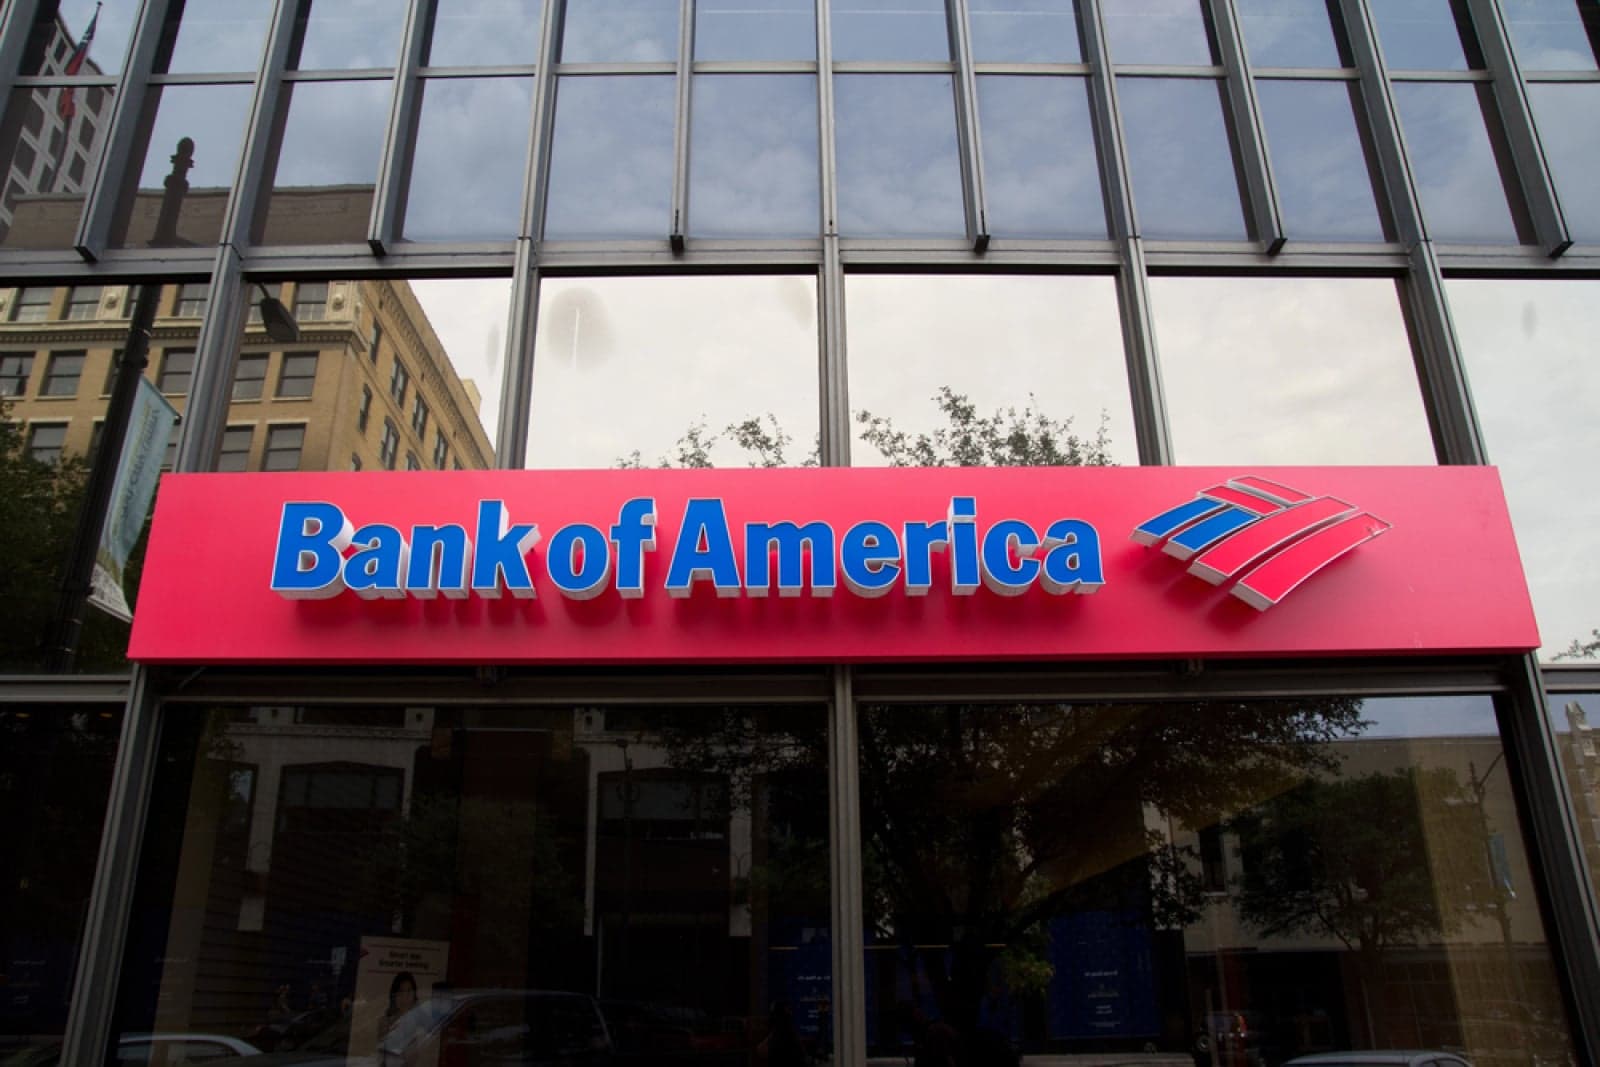
Bank of America increases Bitcoin stake while tripling Ethereum and Solana exposure.

Latest on Pi Network: Token price stabilizes at $0.15 amid update delays.

Analysts predict XRP could fall to $1.14 amid bearish trends.
See every story in Crypto — including breaking news and analysis.
Bitcoin is once again in the neighborhood of $70,000, but unlike earlier clear breakouts or abrupt rejections, the current structure is chaotic, which makes it risky.
BTC found a local bottom in the mid-$60,000s following a prolonged decline from the $120,000 area, and it is currently consolidating inside a tightening symmetrical triangle. Key moving averages above continue to slope downward, while price action reveals higher lows pressing against a declining resistance trendline. As a result, a classic compression scenario is created in a more general bearish environment.
Conflicting signals are the source of the difficulty. Short-term structure is getting better, on the one hand. With each dip, buyers are entering the market earlier, creating an ascending base between $65,000 and $67,000. The RSI is leveling off around neutral levels, indicating that selling pressure is no longer predominant.

Conversely, the macro trend is still negative. The 200-day, which is serving as dynamic resistance, is one of the major moving averages that Bitcoin is still trading below. Every upward push enters supply, and volume exhibits passive absorption rather than aggressive accumulation.
The $70,000 threshold is a battlefield for liquidity as well as psychological. Because it lies in the middle of this compression range, both mean-reversion and breakout traders are active here. For this reason, rather than trending steadily, the price keeps pulling back.
What can investors anticipate then? There will soon be a breakout, but the direction is unclear. As short positions unwind, if BTC breaks above $72,000-$73,000 with volume, it opens a path toward $75,000 and possibly higher. But if $68,000 is not held, the higher low structure would be invalidated, and the price would probably return to $64,000-$62,000, where actual demand would need to demonstrate itself.
DOGE is currently trading tightly between $0.09 and $0.10, with the price barely moving and candles shrinking to nearly flat prints following months of steady decline from the $0.30 region. This behavior is abnormal, in comparison to the past. A market that has essentially gone idle is depicted on the chart.
Momentum indicators like RSI are trapped in neutral territory, volume has decreased and intraday ranges are small. The rapid absorption of even small spikes indicates a lack of engagement on the part of both buyers and sellers. This is stagnation following exhaustion rather than consolidation following strength.
In terms of structure, DOGE is in a downward trend, continuing the tendency of past years. All of the major moving averages are below the price, and they are still declining. There is no indication of an aggressive accumulation, no higher highs or a trend reversal. Instead, there is a liquidity vacuum because there is insufficient participation to significantly move the price in either direction.
A legitimate question is raised by this type of low-volatility environment: is DOGE stabilizing, or is it just becoming less relevant? This can be interpreted in two different ways.
The first is beneficial. Expansion is frequently preceded by extreme compression. When volatility reaches this low, it usually does not stay there. Once liquidity recovers, the price eventually breaks out sharply. In that regard, even though the direction is still unknown, DOGE may be preparing a move.
Less hopeful is the second interpretation. The identity of DOGE has always been connected to social momentum, hype cycles and conjecture. The asset finds it difficult to create organic demand without those motivators. We may be witnessing a gradual decline into insignificance, in which volatility vanishes due to a decline in interest.