XRP Price Gains Strength, Is a Bigger Rally Brewing?

TL;DR
XRP price has increased above $1.40 and is consolidating gains, potentially aiming for more above $1.4150. A bullish trend line is forming with support at $1.370.
Key points
- XRP price started a steady upward move above $1.40
- Price is now trading above $1.40 and the 100-hourly Simple Moving Average
- Bullish trend line forming with support at $1.370
- Price could continue to move up if it settles above $1.4150
- High formed at $1.4157 during the recent price increase
XRP price started a decent increase above $1.3880. The price is now consolidating gains and might aim for more gains above the $1.4150 zone.
- XRP price started a steady upward move above the $1.40 zone.
- The price is now trading above $1.40 and the 100-hourly Simple Moving Average.
- There is a bullish trend line forming with support at $1.370 on the hourly chart of the XRP/USD pair (data source from Kraken).
- The pair could continue to move up if it settles above $1.4150.
XRP Price Climbs above $1.40
XRP price started a fresh upward move above $1.3550 and $1.3750, like Bitcoin and Ethereum. The price gained pace for a clear move above the $1.3880 resistance.
The bulls even pumped the price toward the $1.40 zone. A high was formed at $1.4157, and the price started a consolidation phase above the 23.6% Fib retracement level of the upward move from the $1.3510 swing low to the $1.4157 high.
The price is now trading above $1.40 and the 100-hourly Simple Moving Average. Besides, there is a bullish trend line forming with support at $1.370 on the hourly chart of the XRP/USD pair.
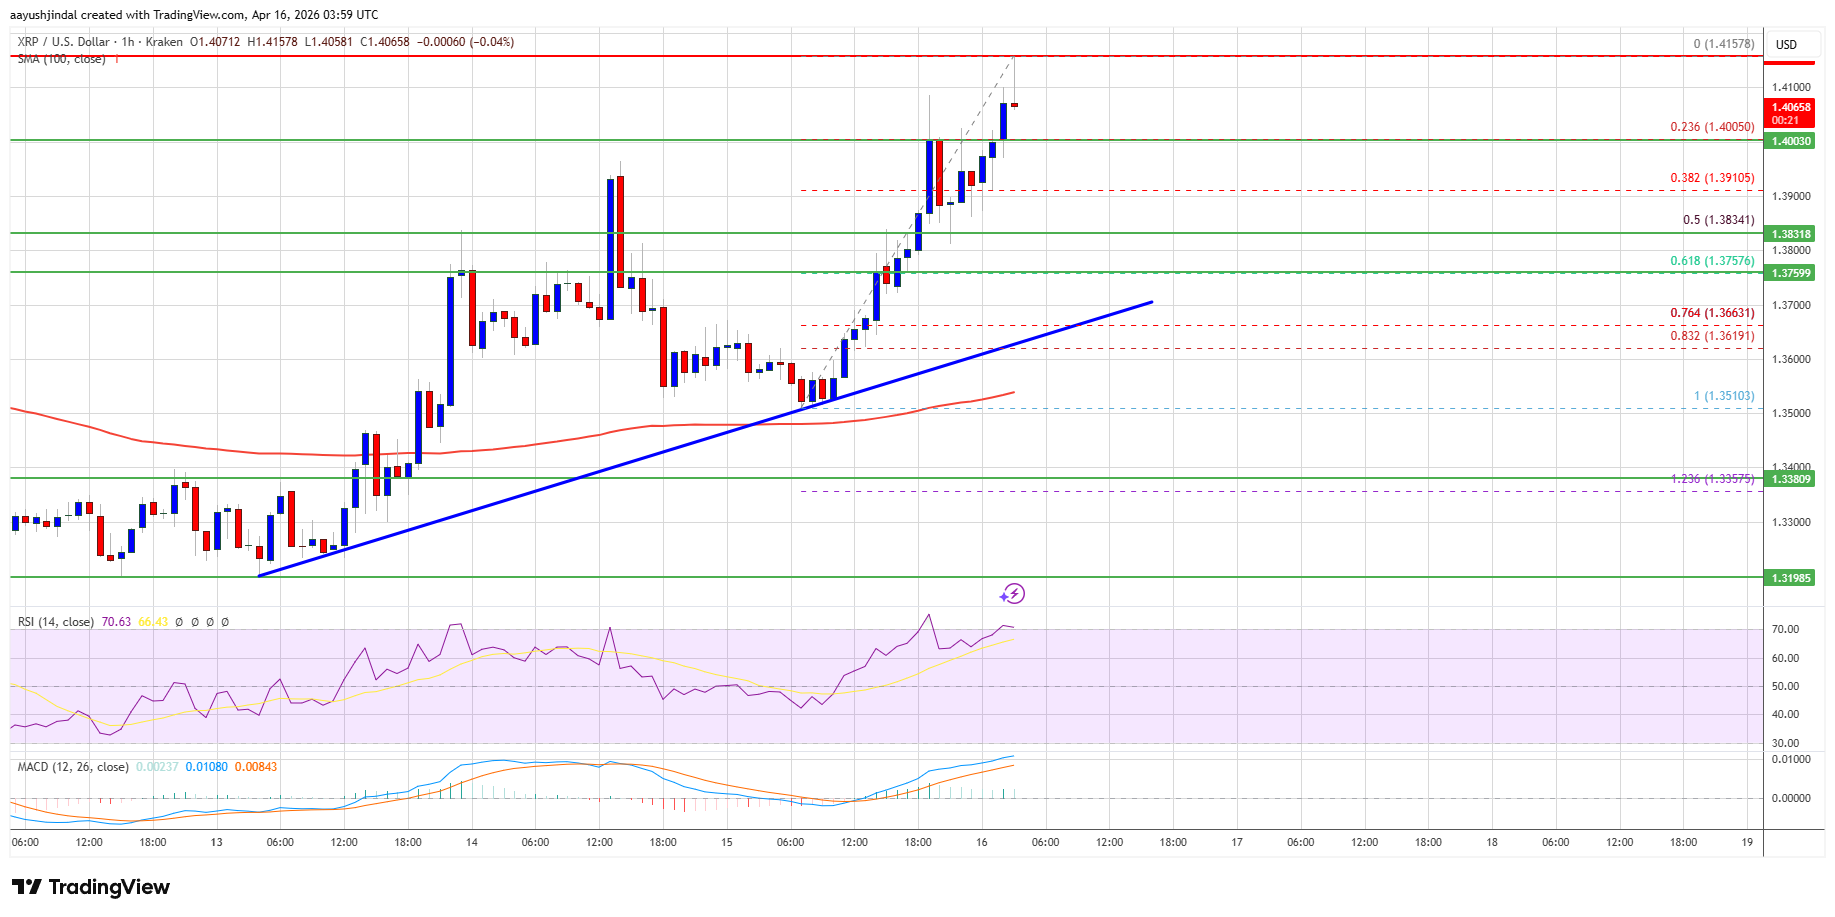
Source: XRPUSD on TradingView.com
If there is a fresh upward move, the price might face resistance near the $1.4150 level. The first major resistance is near the $1.4220 level, above which the price could rise and test $1.440. A clear move above the $1.440 resistance might send the price toward the $1.450 resistance. Any more gains might send the price toward the $1.4650 resistance. The next major hurdle for the bulls might be near $1.4840.
Downside Correction?
If XRP fails to clear the $1.4150 resistance zone, it could start a fresh decline. Initial support on the downside is near the $1.40 level. The next major support is near the $1.3840 level or the 50% Fib retracement level of the upward move from the $1.3510 swing low to the $1.4157 high.
If there is a downside break and a close below the $1.3840 level, the price might continue to decline toward $1.370 and the trend line. The next major support sits near the $1.350 zone, below which the price could continue lower toward $1.3250. The main support could be $1.3120.
Technical Indicators
Hourly MACD – The MACD for XRP/USD is now gaining pace in the bullish zone.
Hourly RSI (Relative Strength Index) – The RSI for XRP/USD is now above the 50 level.
Major Support Levels – $1.3840 and $1.3700.
Major Resistance Levels – $1.4150 and $1.4400.
Q&A
What is the current price trend of XRP?
XRP is currently experiencing an upward trend, having moved above $1.40 and showing potential for further gains.
What resistance levels should XRP traders watch?
Traders should monitor the $1.4150 resistance level, as XRP may continue to rise if it settles above this mark.
Where is the support level for XRP's price?
The support level for XRP is currently at $1.370, as indicated by the bullish trend line on the hourly chart.


