
This Bitcoin Momentum Signal Preceded Last October’s Crash — Another Downturn Incoming?
Bitcoin's recent momentum signals a potential downturn as it weakens. What does this mean for investors?
NewsBTC1 min read

XRP price is currently consolidating above $1.4450 after a correction from $1.5050. The bullish trend may continue if it settles above $1.480.
XRP price started a downside correction from the $1.5050 zone. The price is now consolidating and might aim for another increase if it stays above the $1.4450 zone.
XRP price started a decent upward move above $1.4350 and $1.4550, outperforming Bitcoin and Ethereum. The price gained pace for a clear move above the $1.480 resistance.
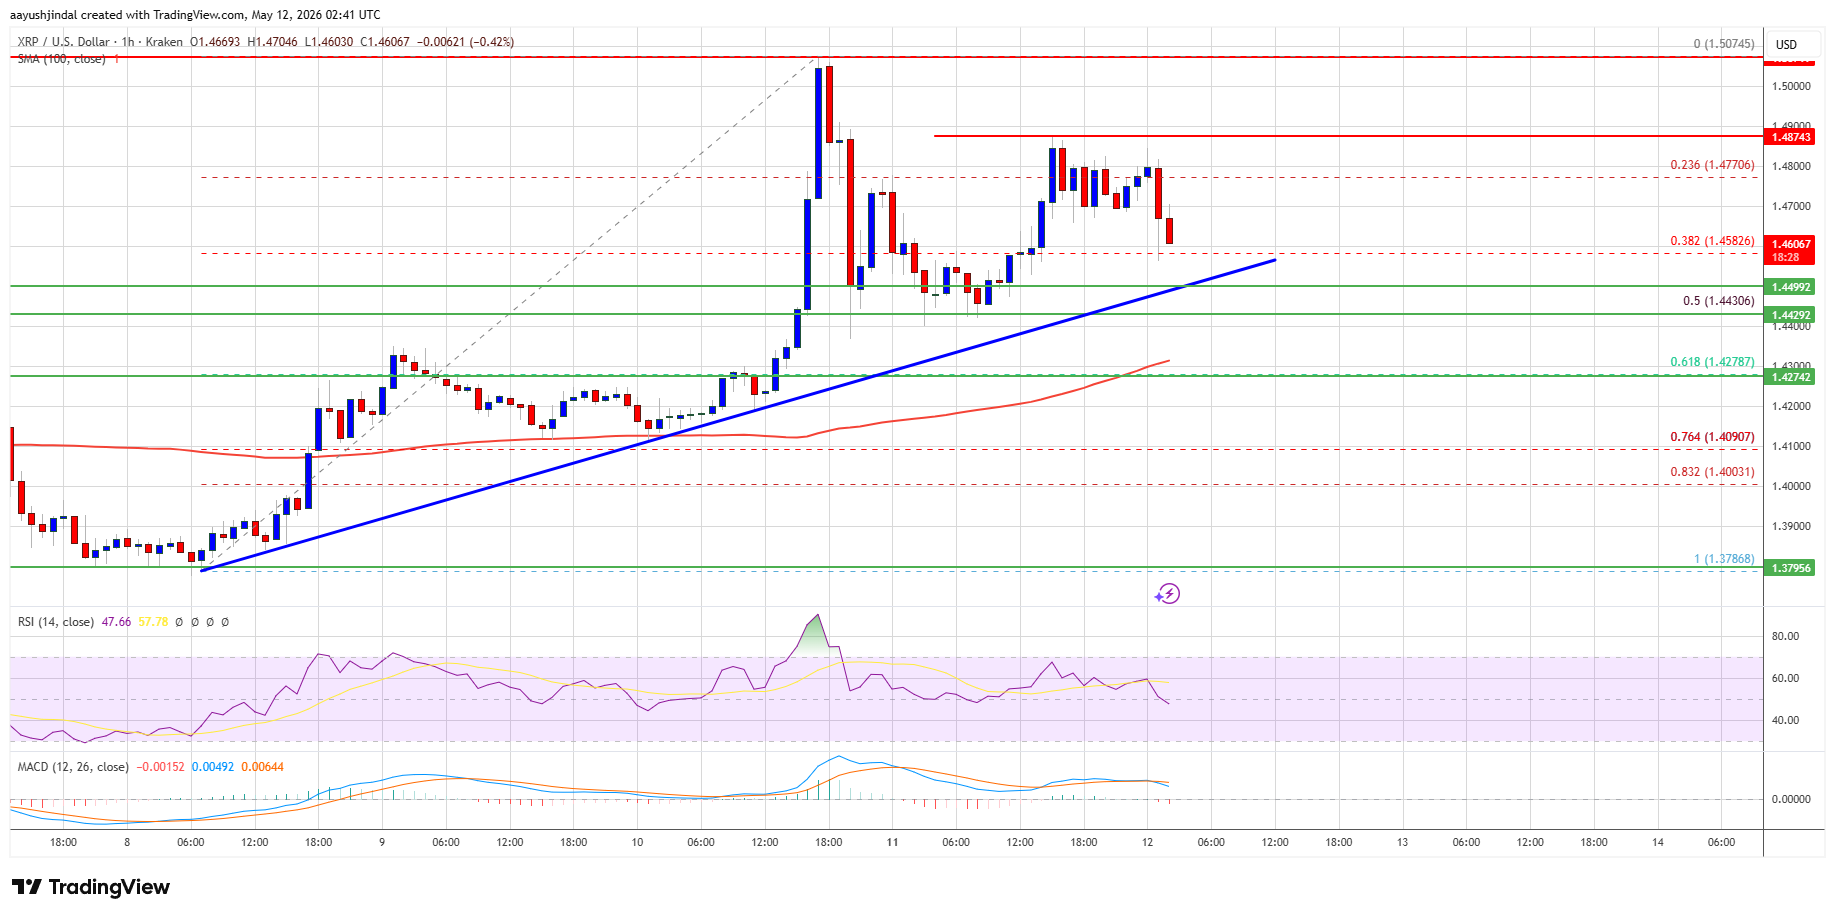
A high was formed at $1.5074, and the price started a downside correction. There was a move below $1.4750 and $1.4650. The price dipped below the 38.2% Fib retracement level of the upward move from the $1.3785 swing low to the $1.5074 high.
The price is now trading above $1.4450 and the 100-hourly Simple Moving Average. There is also a bullish trend line forming with support at $1.4450 on the hourly chart of the XRP/USD pair.
Source: XRPUSD on TradingView.com
If there is a fresh upward move, the price might face resistance near the $1.4720 level. The first major resistance is near the $1.480 level, above which the price could rise and test $1.4880. A clear move above the $1.4880 resistance might send the price toward the $1.50 resistance. Any more gains might send the price toward the $1.520 resistance. The next major hurdle for the bulls might be near $1.550.
If XRP fails to clear the $1.4720 resistance zone, it could start a fresh decline. Initial support on the downside is near the $1.4450 level. The next major support is near the $1.4430 level and the trend line or the 50% Fib retracement level of the upward move from the $1.3785 swing low to the $1.5074 high.
XRP is currently consolidating above $1.4450 after a recent correction from $1.5050.
The critical support level for XRP to maintain upward momentum is $1.4450.
XRP has outperformed both Bitcoin and Ethereum, gaining momentum above the $1.480 resistance.
Bitcoin's recent momentum signals a potential downturn as it weakens. What does this mean for investors?

Bitcoin drops to over $74,000 and Ethereum dips to $2,000 this weekend.

Bitcoin's price drops to $74K as bearish market trends intensify.

Bitcoin and Ethereum's Sharpe Ratio diverges, hinting at potential price changes.

XRP drops to a six-week low of $1.33 as whale activity declines significantly.

Dogecoin price drops to monthly lows, but whales are loading up on DOGE.
See every story in Crypto — including breaking news and analysis.
If there is a downside break and a close below the $1.4430 level, the price might continue to decline toward $1.4280. The next major support sits near the $1.4280 zone, below which the price could continue lower toward $1.4120. Any more losses might call for a test of $1.4050.
Technical Indicators
Hourly MACD – The MACD for XRP/USD is now gaining pace in the bearish zone.
Hourly RSI (Relative Strength Index) – The RSI for XRP/USD is now above the 50 level.
Major Support Levels – $1.4450 and $1.4280.
Major Resistance Levels – $1.4720 and $1.4880.