JPMorgan: Bitcoin Races Ahead of Ethereum
JPMorgan reports Bitcoin is significantly outperforming Ethereum and altcoins.
U.Today1 min read

XRP dropped nearly 8% after failing to break the $1.55 resistance. A market analyst suggests a multi-year Cup and Handle pattern could signal a potential price rally.
After being rejected from the $1.55 barrier on Thursday, XRP dropped nearly 8%, continuing its consolidation below this crucial resistance. Amid this performance, a market watcher highlighted a multi-year pattern that could push the price toward new highs.
On Friday, market observer ChartNerd shared a long-term perspective on the XRP price, based on a multi-year formation with “significant macro future upside potential waiting ahead.”
In an X post, the analyst highlighted a Cup and Handle pattern, which has been forming since 2018. The chart below shows that the pattern completed the cup during its mid-2025 rally and has been forming the handle since the altcoin reached its latest all-time high (ATH).

XRP displays a multi-year Cup and Handle Pattern. Source: ChartNerd on X
Based on this, he suggested that XRP “may seek a Gaussian Channel retest to mark a periodic bottom,” as the indicator has been a strong confluence area over the past nine years.
Notably, the cryptocurrency has seen three similar retests within the cup, and also marked the cycle low in 2017. Now, the $0.70-$0.90 area may also mark the handle’s bottom, where the 0.50 FIB level awaits in the same territory as support.
The market watcher has previously explained that a rejection from the $1.60-$1.80 area is likely and will potentially send XPP toward a cycle bottom of $0.70 later in the year, as it marks a prior level of macro resistance that hasn’t been retested yet.
Nonetheless, he affirmed that, regardless of where the macro low is marked, “future FIB extensions await above targeting $8,” with two potential double-digit targets sitting around the $13 and $27 marks.
ChartNerd also noted that the potential handle bottom of the Cup and Handle formation aligns with a key multi-year retest inside a fractal. For context, XRP appears to be repeating a setup that led to its massive 68,000% expansion during the 2017-2018 rally.
XRP has recently dropped nearly 8% after being rejected at the $1.55 resistance level.
The Cup and Handle pattern for XRP has been forming since 2018, indicating potential future price increases.
The rally for XRP is anticipated to occur after the completion of the Cup and Handle pattern, projected around mid-2025.
JPMorgan reports Bitcoin is significantly outperforming Ethereum and altcoins.
ETH trader sentiment falls to its lowest level in three years as bearish calls increase.

XRP is close to breaking $1.50, which could trigger a major rally. Analysts are watching closely!
Coinbase warns of possible disruptions this weekend due to a system upgrade.

Ethereum price is struggling to break above $2,150 resistance after a recovery wave.
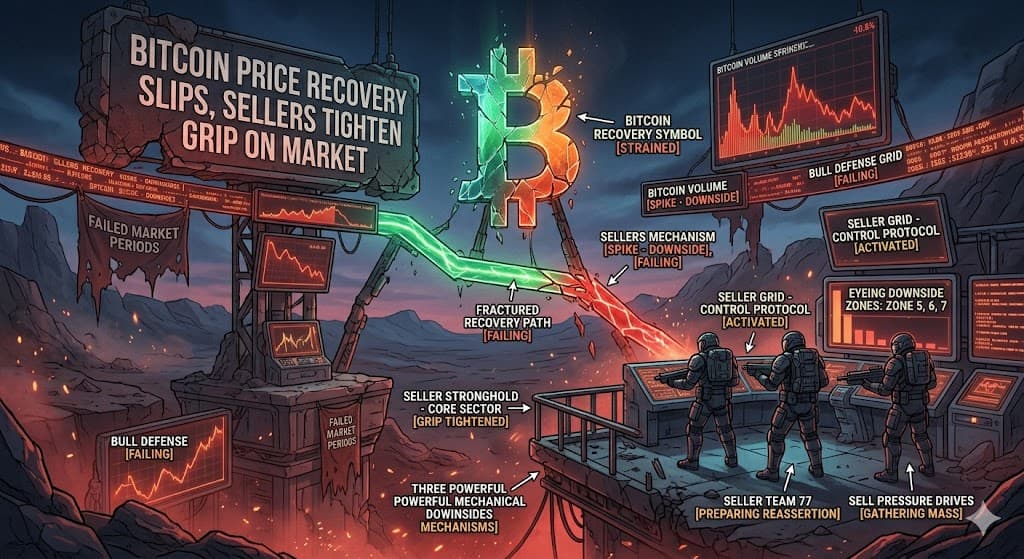
Bitcoin price stabilizes above $76K as traders await next move.
See every story in Crypto — including breaking news and analysis.
Ahead of its 2027 breakout, the cryptocurrency retested its multi-year ascending support three times, experiencing significant advances followed by strong corrections inside descending channels.
Since 2020, the altcoin has been developing the same pre-breakout setup, when XRP reached its bear market bottom and created an ascending support level that has held for roughly six years.
After two retests of the crucial support, the cryptocurrency appears to be developing the same descending channel, which could lead to a third retest of the ascending trendline, and an eventual 2,000% multi-month rally toward a new double-digit high.
“If XRP respects this pattern into late 2026, this is where we could potentially create the third retest, which is what we saw in the early cycles before the expansion in 2017,” the analyst previously stated.
As of this writing, XRP trades at $1.43, a 6% decline on the daily timeframe.

XRP’s performance on the one-week chart. Source: XRPUSDT on TradingView
Featured Image from Unsplash.com, Chart from TradingView.com