
CLARITY Act Boosts Bitcoin Outlook – But Analysts See Risks Ahead
The CLARITY Act's passage boosts Bitcoin's outlook, but risks loom ahead.
CryptoPotato1 min read

Bitcoin price is currently consolidating after a correction from the $82,000 zone, trading above $80,500. A fresh increase may occur if it clears the $82,000 resistance level.
Bitcoin price started a downside correction from the $82,000 zone. BTC is consolidating and might aim for a fresh increase if it clears $82,000.
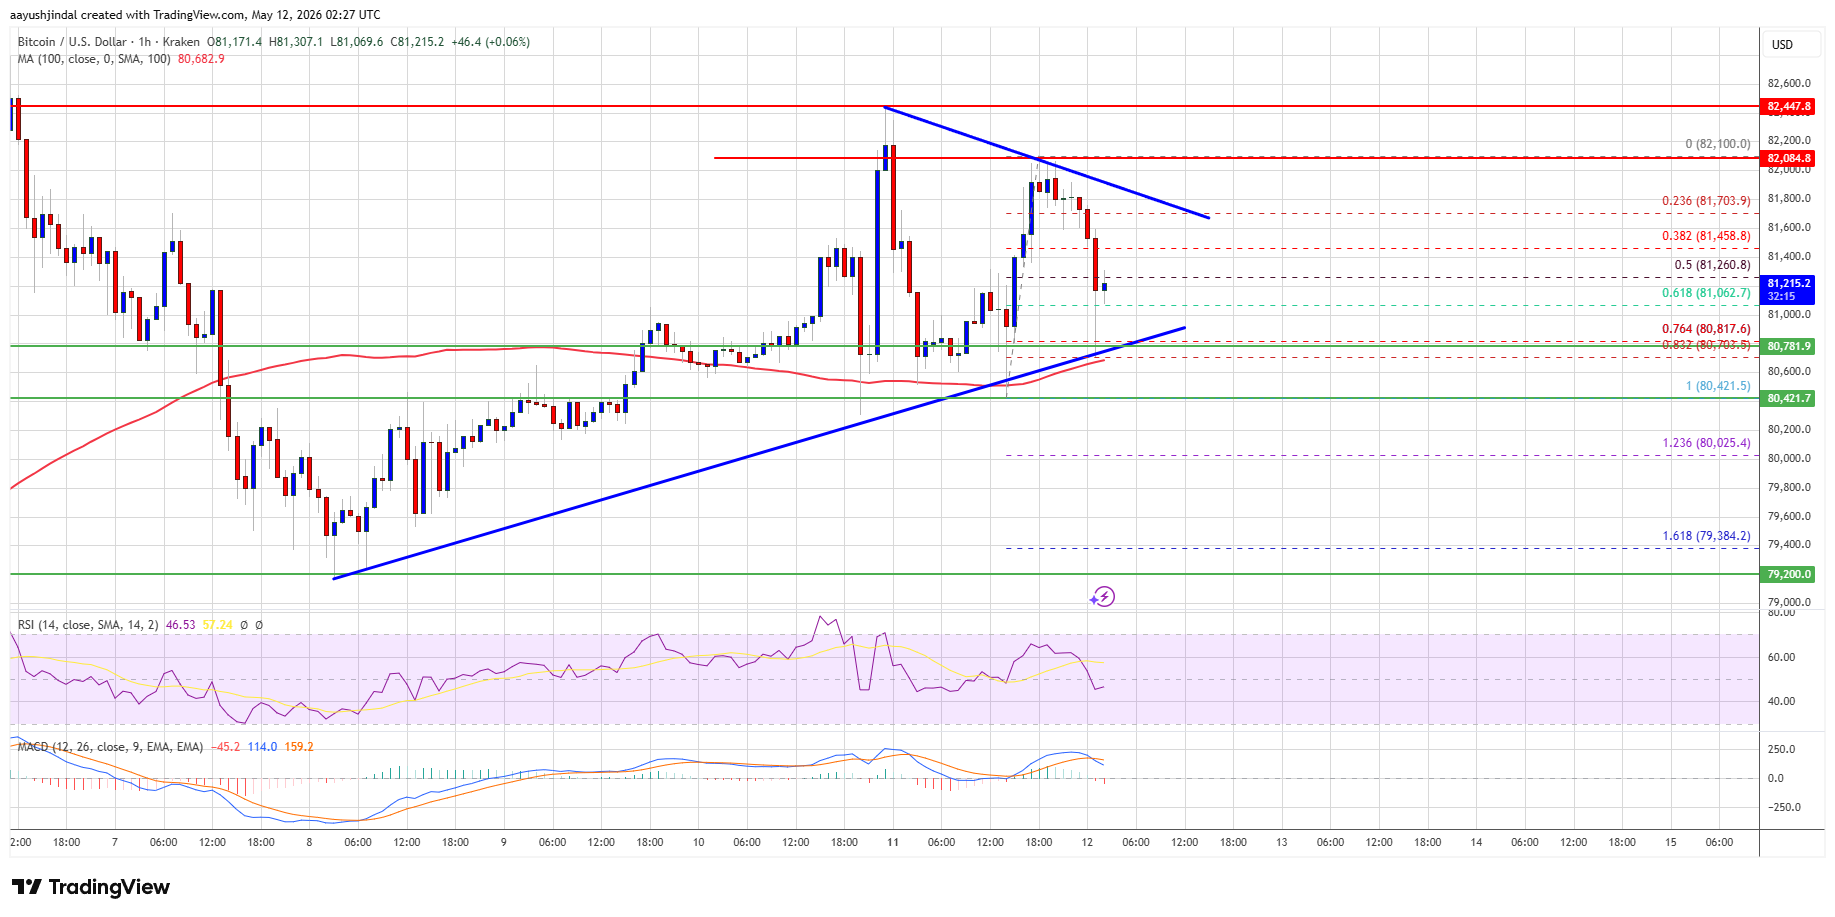
Bitcoin price failed to clear the $82,000 resistance zone. BTC started a downside correction below the $81,500 and $81,200 levels to enter a short-term bearish zone.
There was a move below the 50% Fib retracement level of the upward move from the $80,421 swing low to the $82,100 high. However, the bulls were active above $80,500. There is also a key contracting triangle forming with support at $80,800 on the hourly chart of the BTC/USD pair.
Bitcoin is now trading above $80,500 and the 100 hourly simple moving average. If the price remains stable above $80,500, it could attempt a fresh increase. Immediate resistance is near the $81,500 level.
Source: BTCUSD on TradingView.com
The first key resistance is near the $81,800 level. A close above the $81,800 resistance might send the price further higher. In the stated case, the price could rise and test the $82,250 resistance. Any more gains might send the price toward the $82,500 level. The next barrier for the bulls could be $83,500.
If Bitcoin fails to rise above the $81,800 resistance zone, it could start another decline. Immediate support is near the $80,800 level or the 76.4% Fib retracement level of the upward move from the $80,421 swing low to the $82,100 high.
The current support level for Bitcoin price is at $80,800.
Bitcoin must clear the resistance levels of $81,800 and $82,000 to potentially rally.
Bitcoin price failed to stay above $82,000 and entered a short-term bearish zone after dipping below $81,500.
The CLARITY Act's passage boosts Bitcoin's outlook, but risks loom ahead.

The CLARITY Act clears the way for XRP's rise, targeting $2.
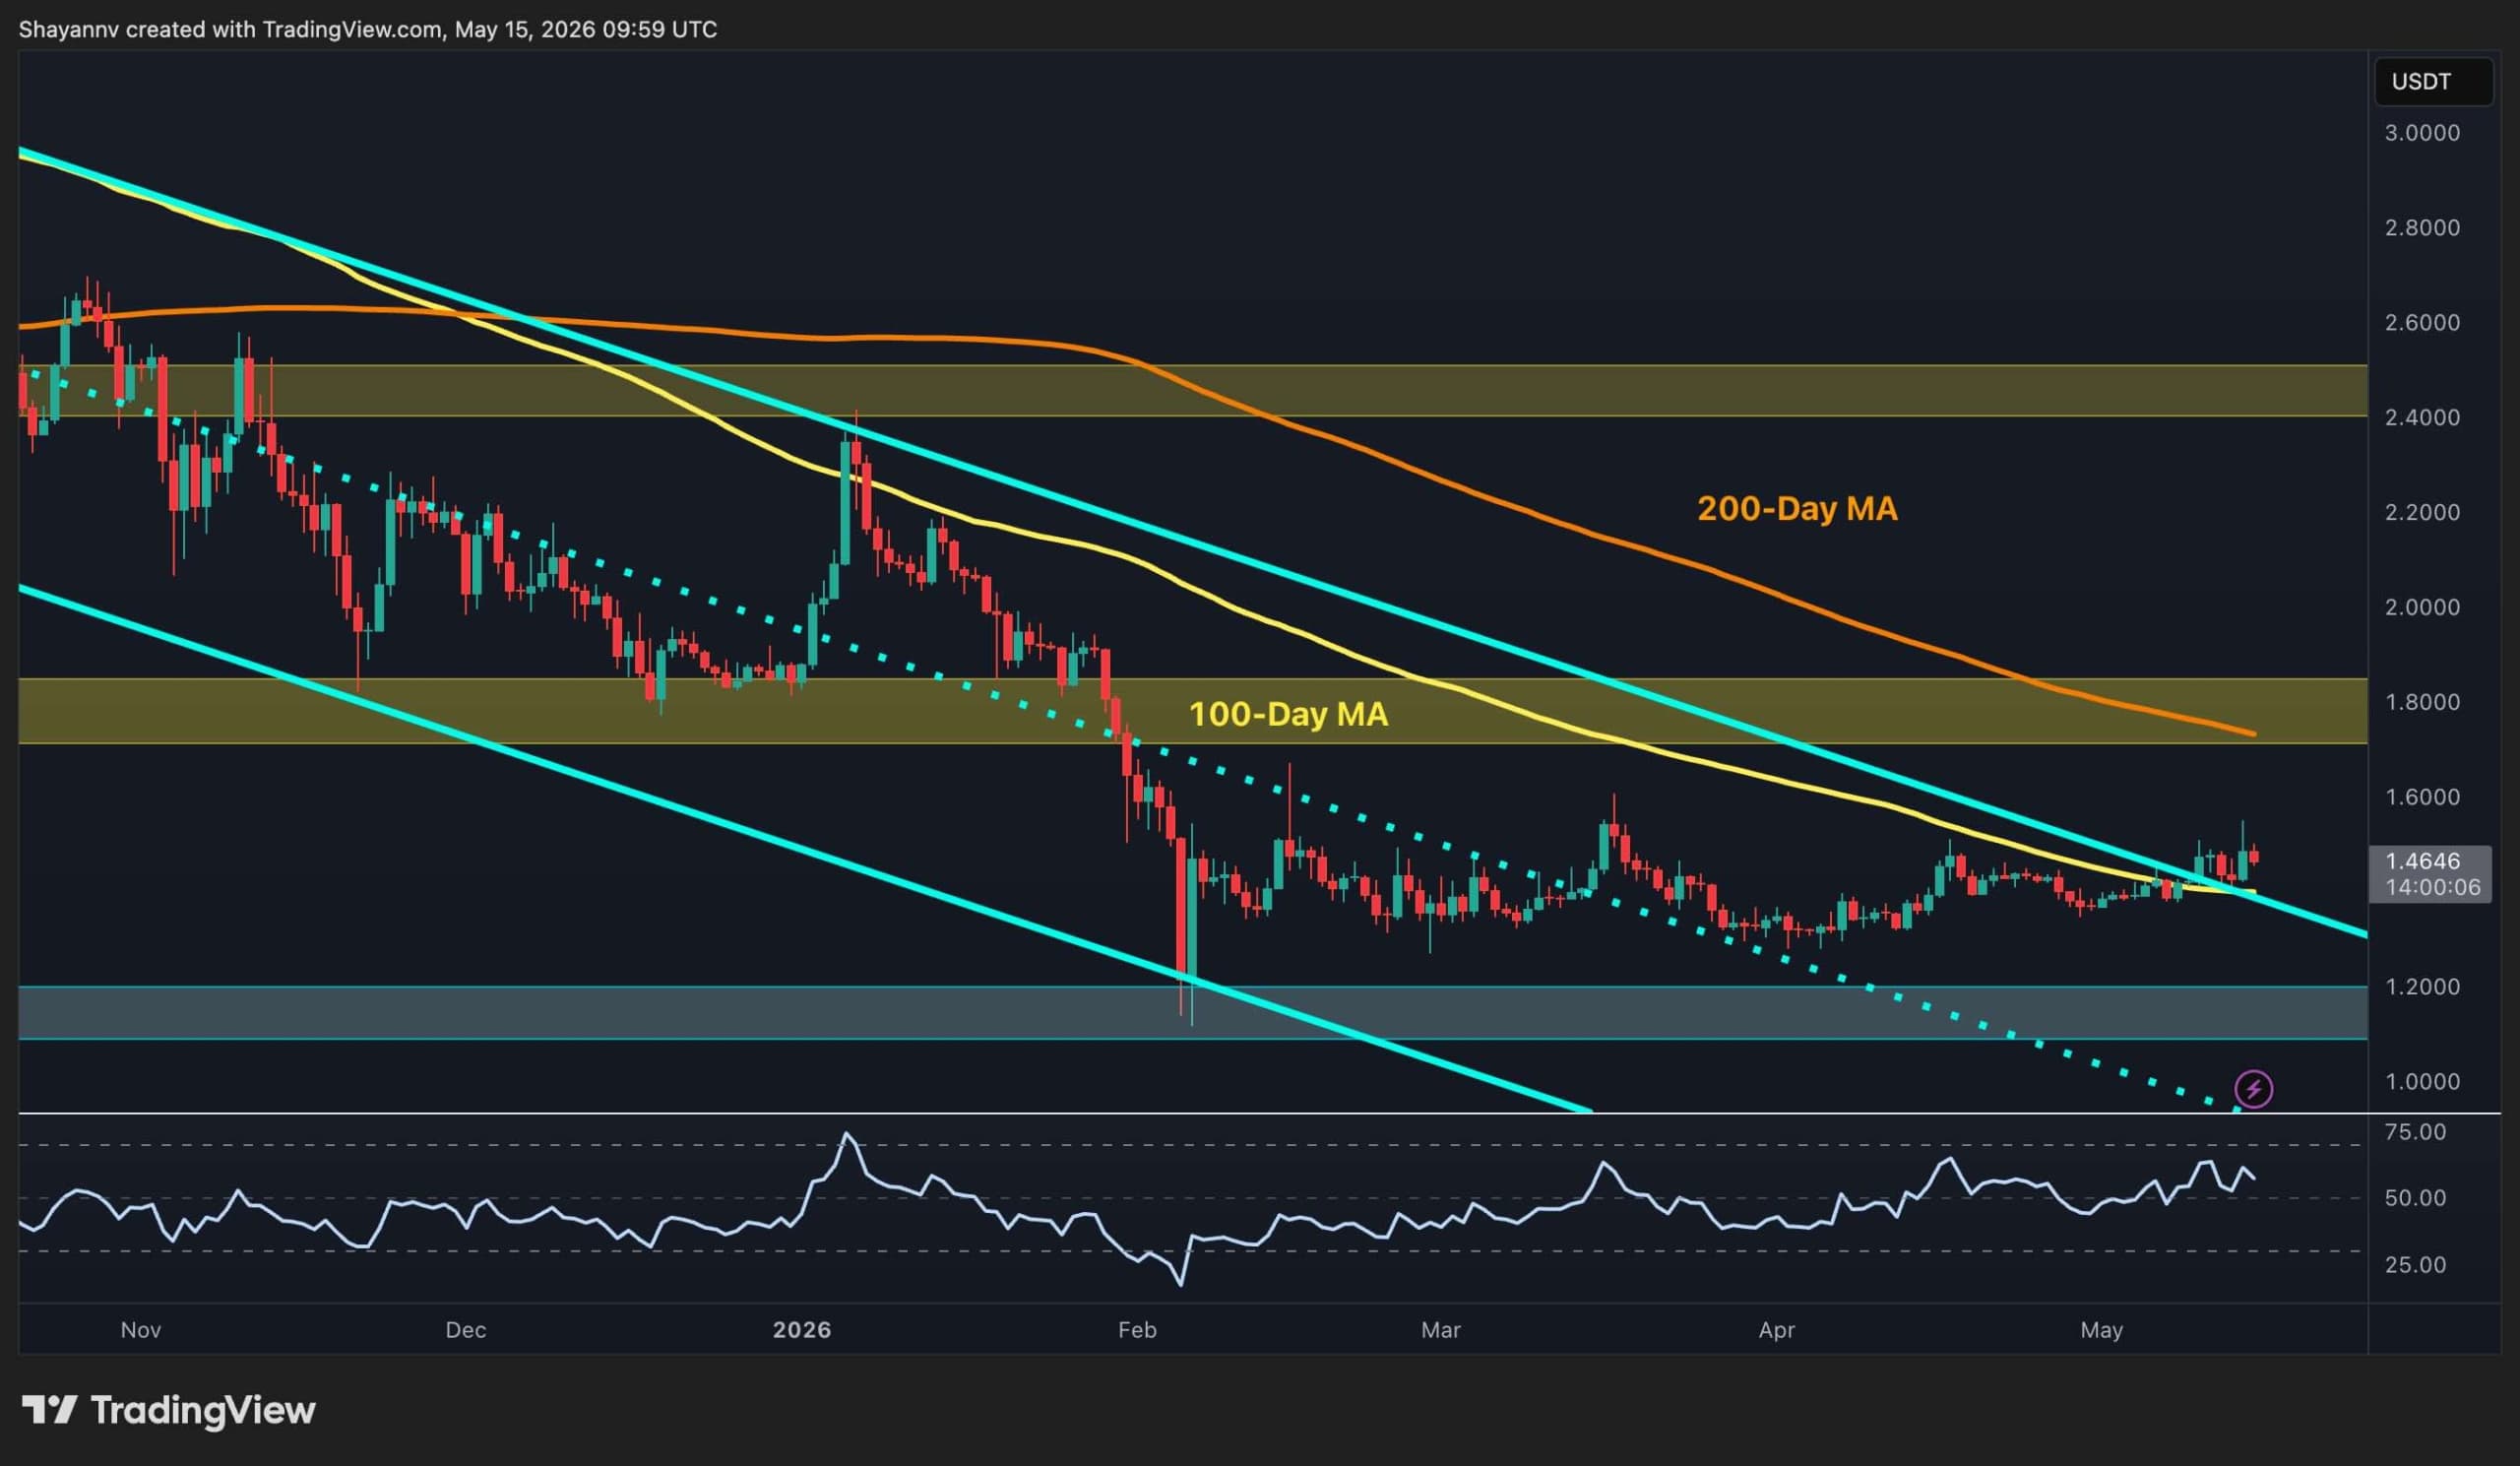
XRP shows bullish momentum, trading at $1.43 and breaking key resistance levels.
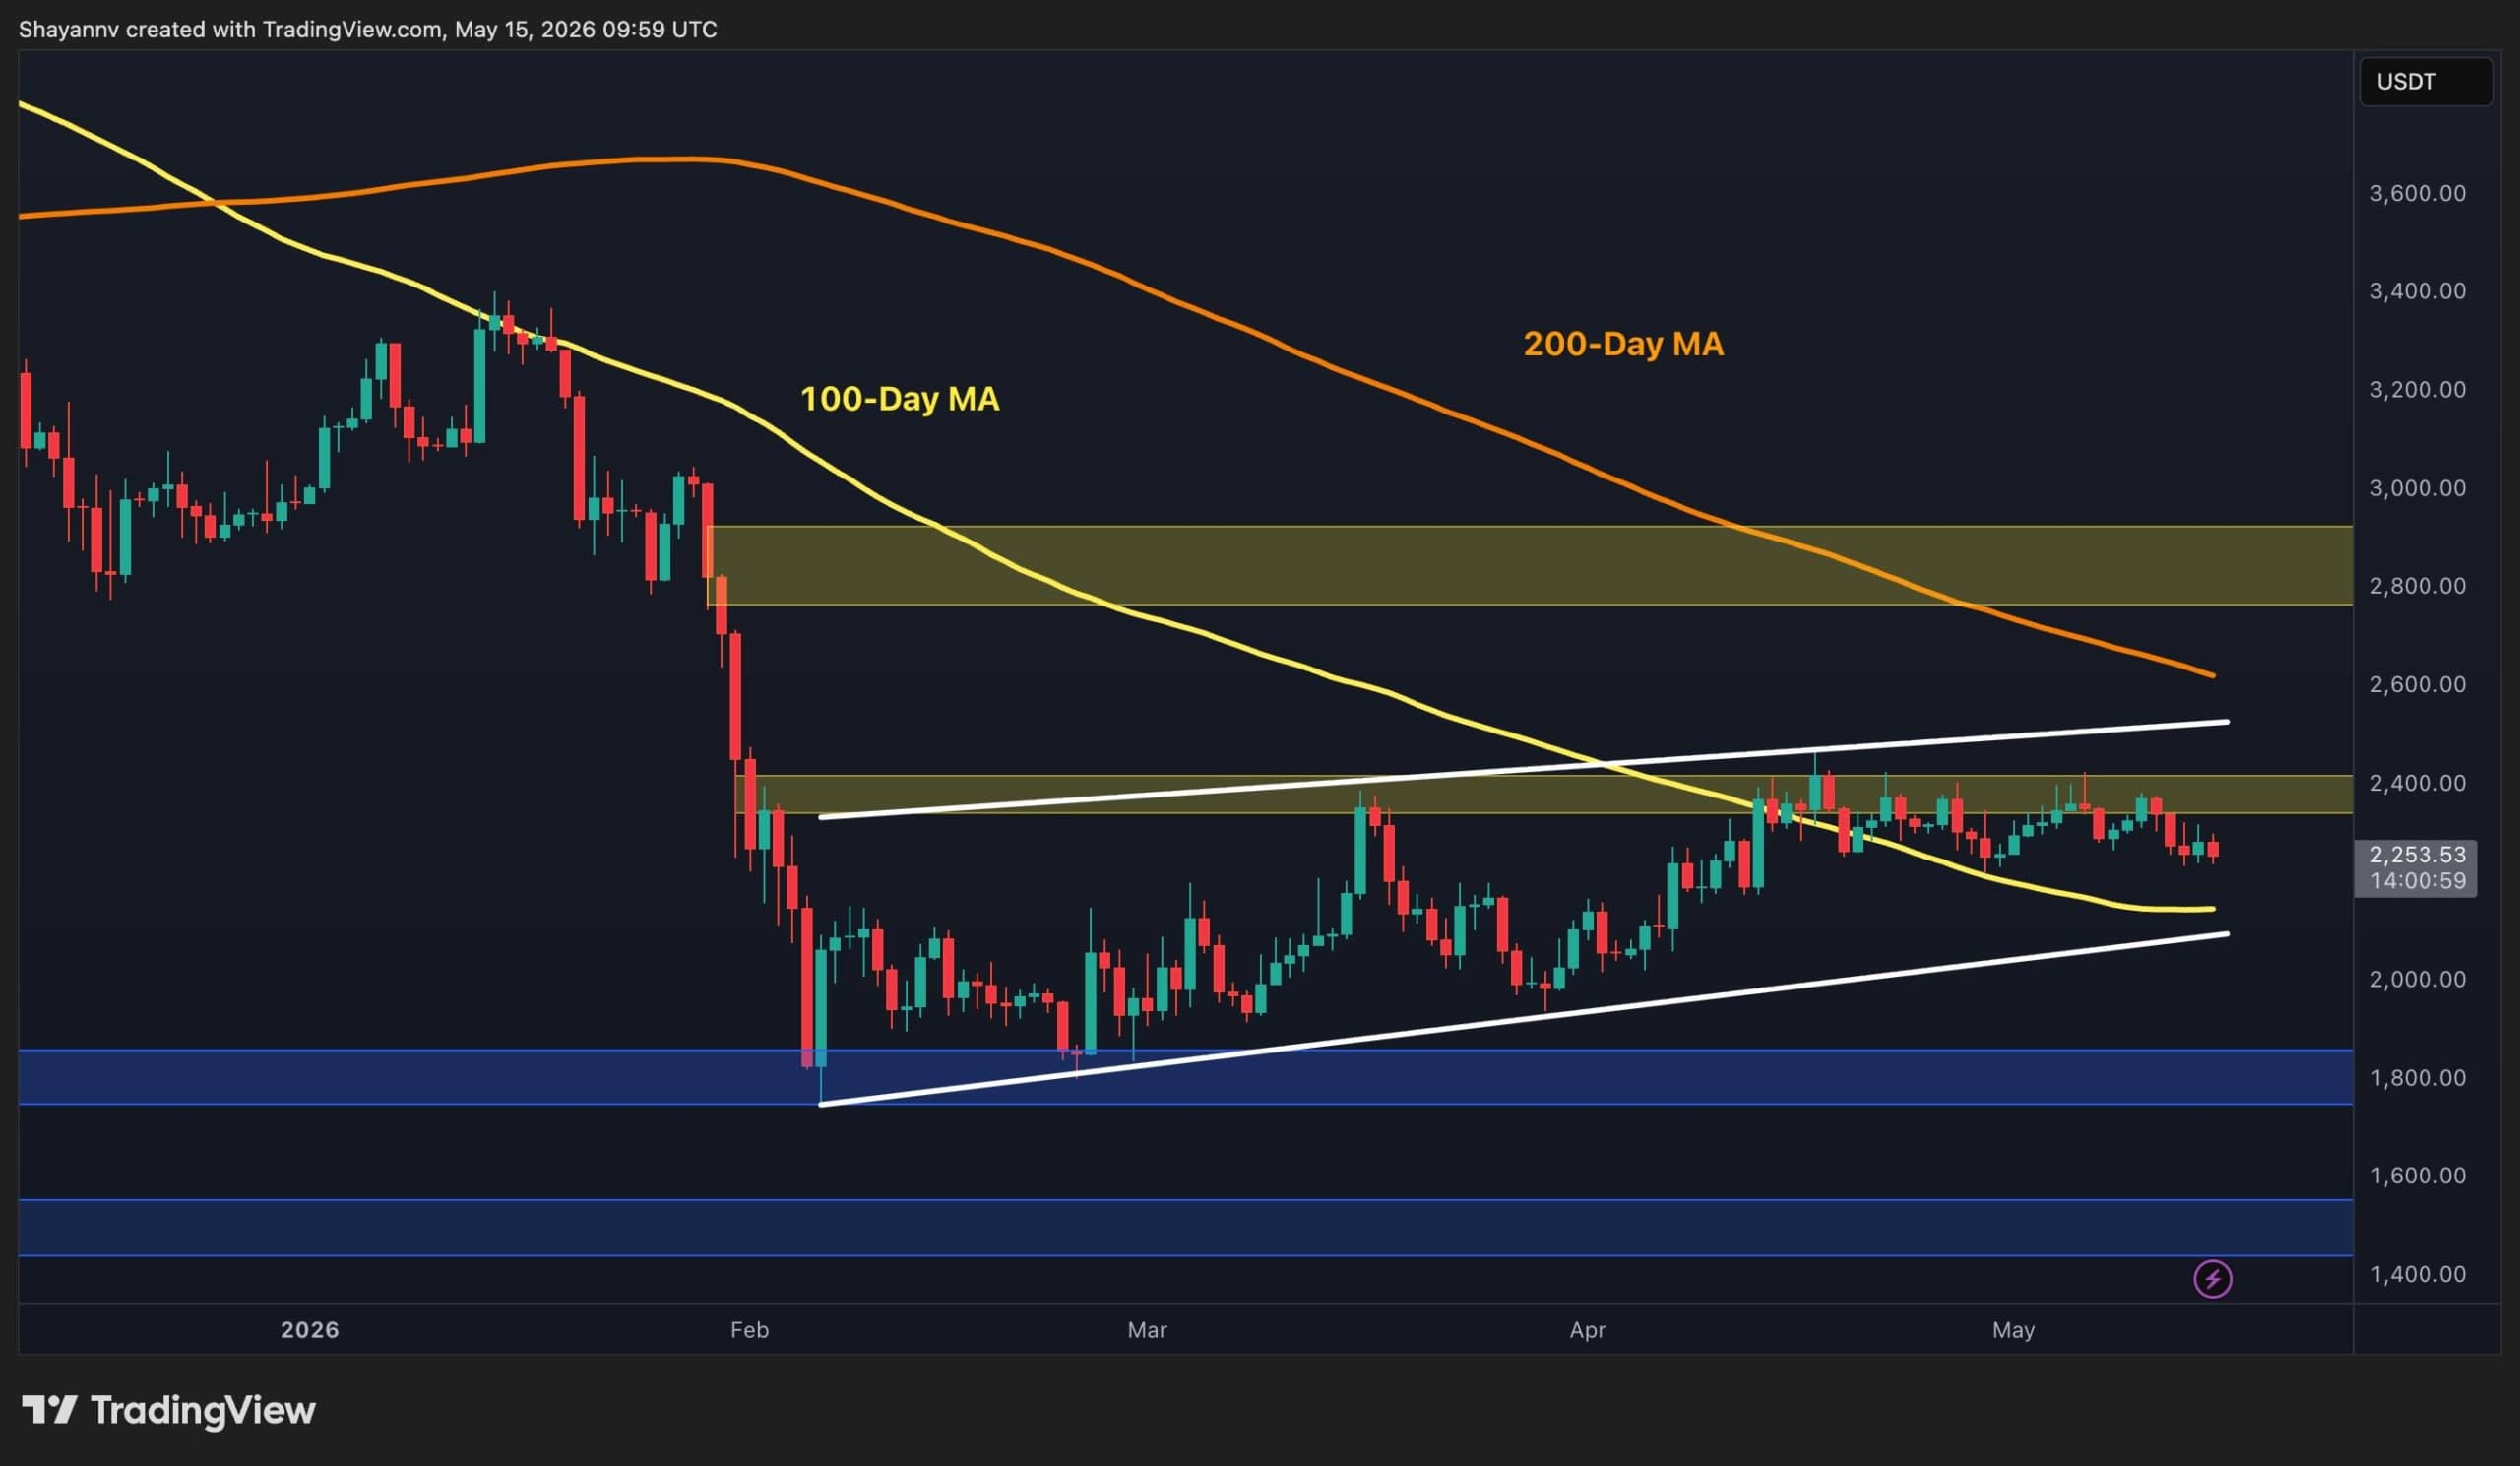
Ethereum is currently trading above $2.2k but faces resistance at $2.4k. More consolidation is expected as long positions have been unwound and a close below $2k could indicate significant structural damage.

Ethereum has triggered a Tom Demark (TD) Sequential sell signal on its weekly chart, indicating a potential trend reversal. This signal previously preceded a significant 63% price drop for the asset.

HYPE token falls 6% as CME and ICE target Hyperliquid over oil risks.
See every story in Crypto — including breaking news and analysis.
The first major support is near the $80,400 level. The next support is now near the $79,400 zone. Any more losses might send the price toward the $79,000 support in the near term. The main support now sits at $78,500, below which BTC might struggle to recover in the near term.
Technical indicators:
Hourly MACD – The MACD is now gaining pace in the bearish zone.
Hourly RSI (Relative Strength Index) – The RSI for BTC/USD is now below the 50 level.
Major Support Levels – $80,800, followed by $80,400.
Major Resistance Levels – $81,800 and $82,000.