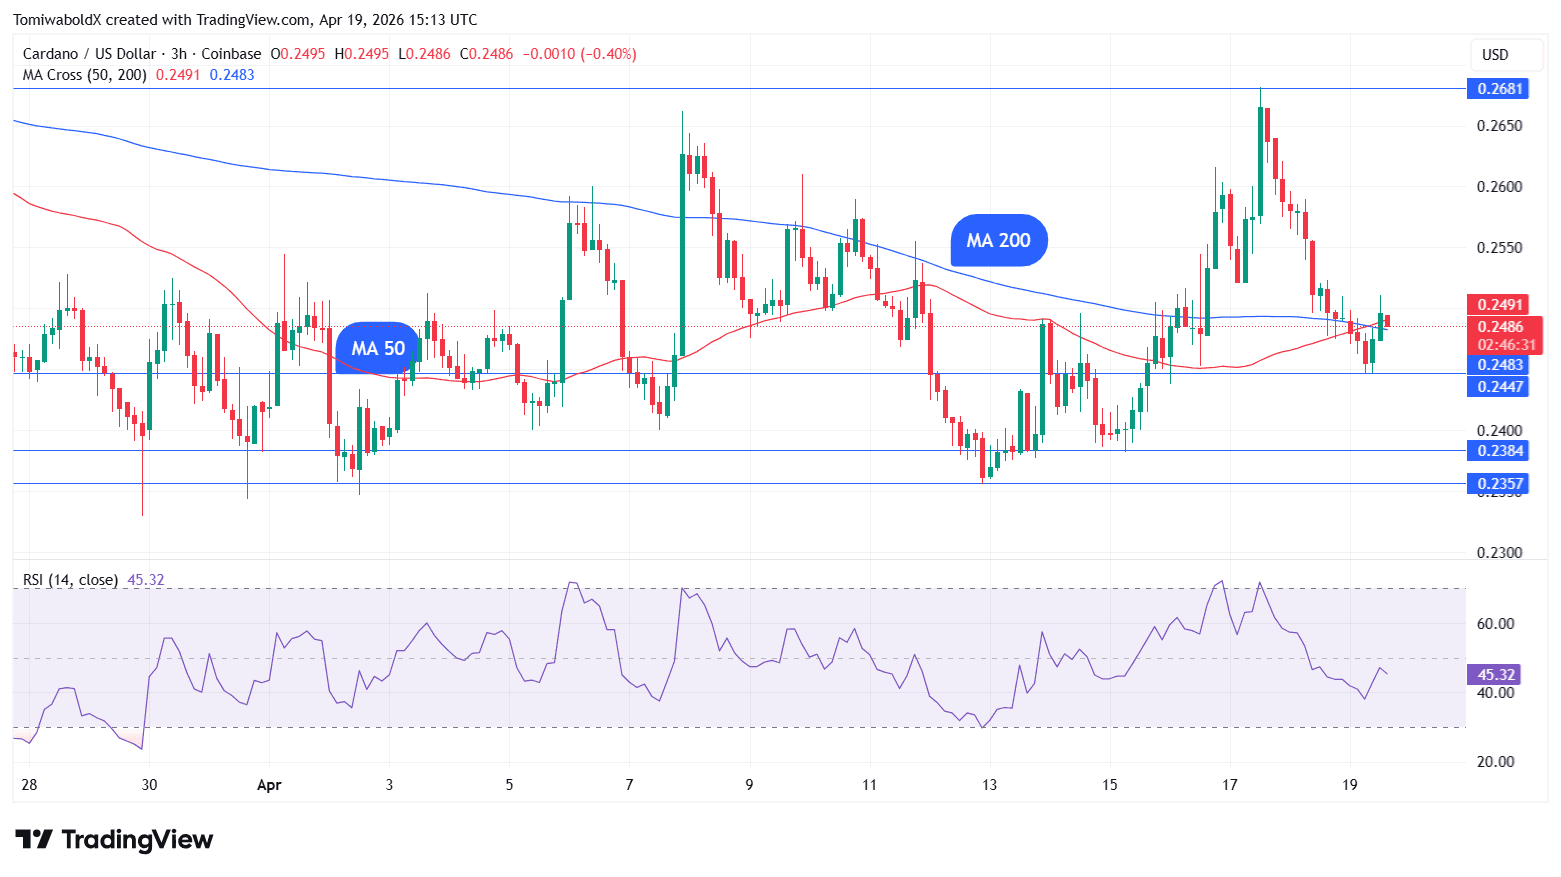
Cardano (ADA) has formed a golden cross on its three-hour chart, with the 50 MA surpassing the 200 MA. This development occurs amid a broader market drop, raising concerns about a potential bull trap.
Key points
Cardano formed a golden cross on its three-hour chart
However, the appearance of the golden cross coincides with a drop in the broader crypto markets, which have seen $254 million worth of positions liquidated in a 24-hour time frame. Long positions or traders who were anticipating further price increases accounted for the majority of this figure, at $180 million, while short liquidations came in at $74 million.
Cardano fell for two straight days toward the weekend, and is currently down 1.04% in the last 24 hours to $0.2496. The cryptocurrency is up 4.80% in the last seven days as it extended a recovery from a low of $0.236 on April 13.
Bull trap or setup?
The derivatives market shows traders remain largely defensive. Funding rates for perpetual futures contracts, a key measure of whether leveraged traders are betting on higher or lower prices, stay negative across most crypto assets.
Cardano has been oscillating between the daily MA 50 at $0.257 and the $0.23 support for the past few days.
The cryptocurrency has been in a larger range between $0.22 and $0.3 since early February. At the moment, Cardano faces a key test at the daily MA 50 after several attempts to breach this level failed in April.
On April 7, 8, 16 and 17, Cardano attempted to surpass this level but retreated afterward. ADA rose to a high of $0.264 on April 17 in one of such attempts but retreated afterward.
Buyers will have to push ADA's price above the daily MA 50 and then $0.3 to signal a potential trend change. ADA may then climb toward $0.36. The RSI at neutral (50) suggests the possibility of sideways trading in the coming days. The current price range has support at $0.22.
Q&A
What does the golden cross mean for Cardano (ADA)?
A golden cross indicates a potential bullish trend, as the 50-day moving average crosses above the 200-day moving average.
Why is the timing of the golden cross concerning for ADA investors?
The golden cross appears during a market drop, leading to fears that it may signal a bull trap rather than a genuine upward trend.
How much were positions liquidated in the crypto market recently?
In the last 24 hours, $254 million worth of positions were liquidated, with $180 million from long positions.
Hyperliquid (HYPE) To $100? Expert Forecasts Major Rise Before Summer 2027
Hyperliquid (HYPE) ETF debuted in the US with over $1 million in first-day inflows, but its price fell about 4% to $38. Analysts suggest a potential rise to $100 by summer 2027 as market conditions improve.