
2 Days Left: XRP Amendment With Rare 100% Consensus Eyes Activation
XRP's 'fixCleanup3_1_3' amendment achieves 100% consensus, activating soon!
U.Today1 min read

XRP has been consolidating below $1.40 for 20 days, but new data indicates a potential bullish breakout as Binance activity shows reduced sell-side pressure.
XRP (XRP) has consolidated within a tight price range below $1.40 over the past 20 days, but new data suggests it may be poised for a bullish breakout after a shift in Binance activity signals reduced sell-side pressure.
Binance’s withdrawal and deposit activity is flashing a setup that mirrors June 2025, when the altcoin embarked on a rally to $3.65.
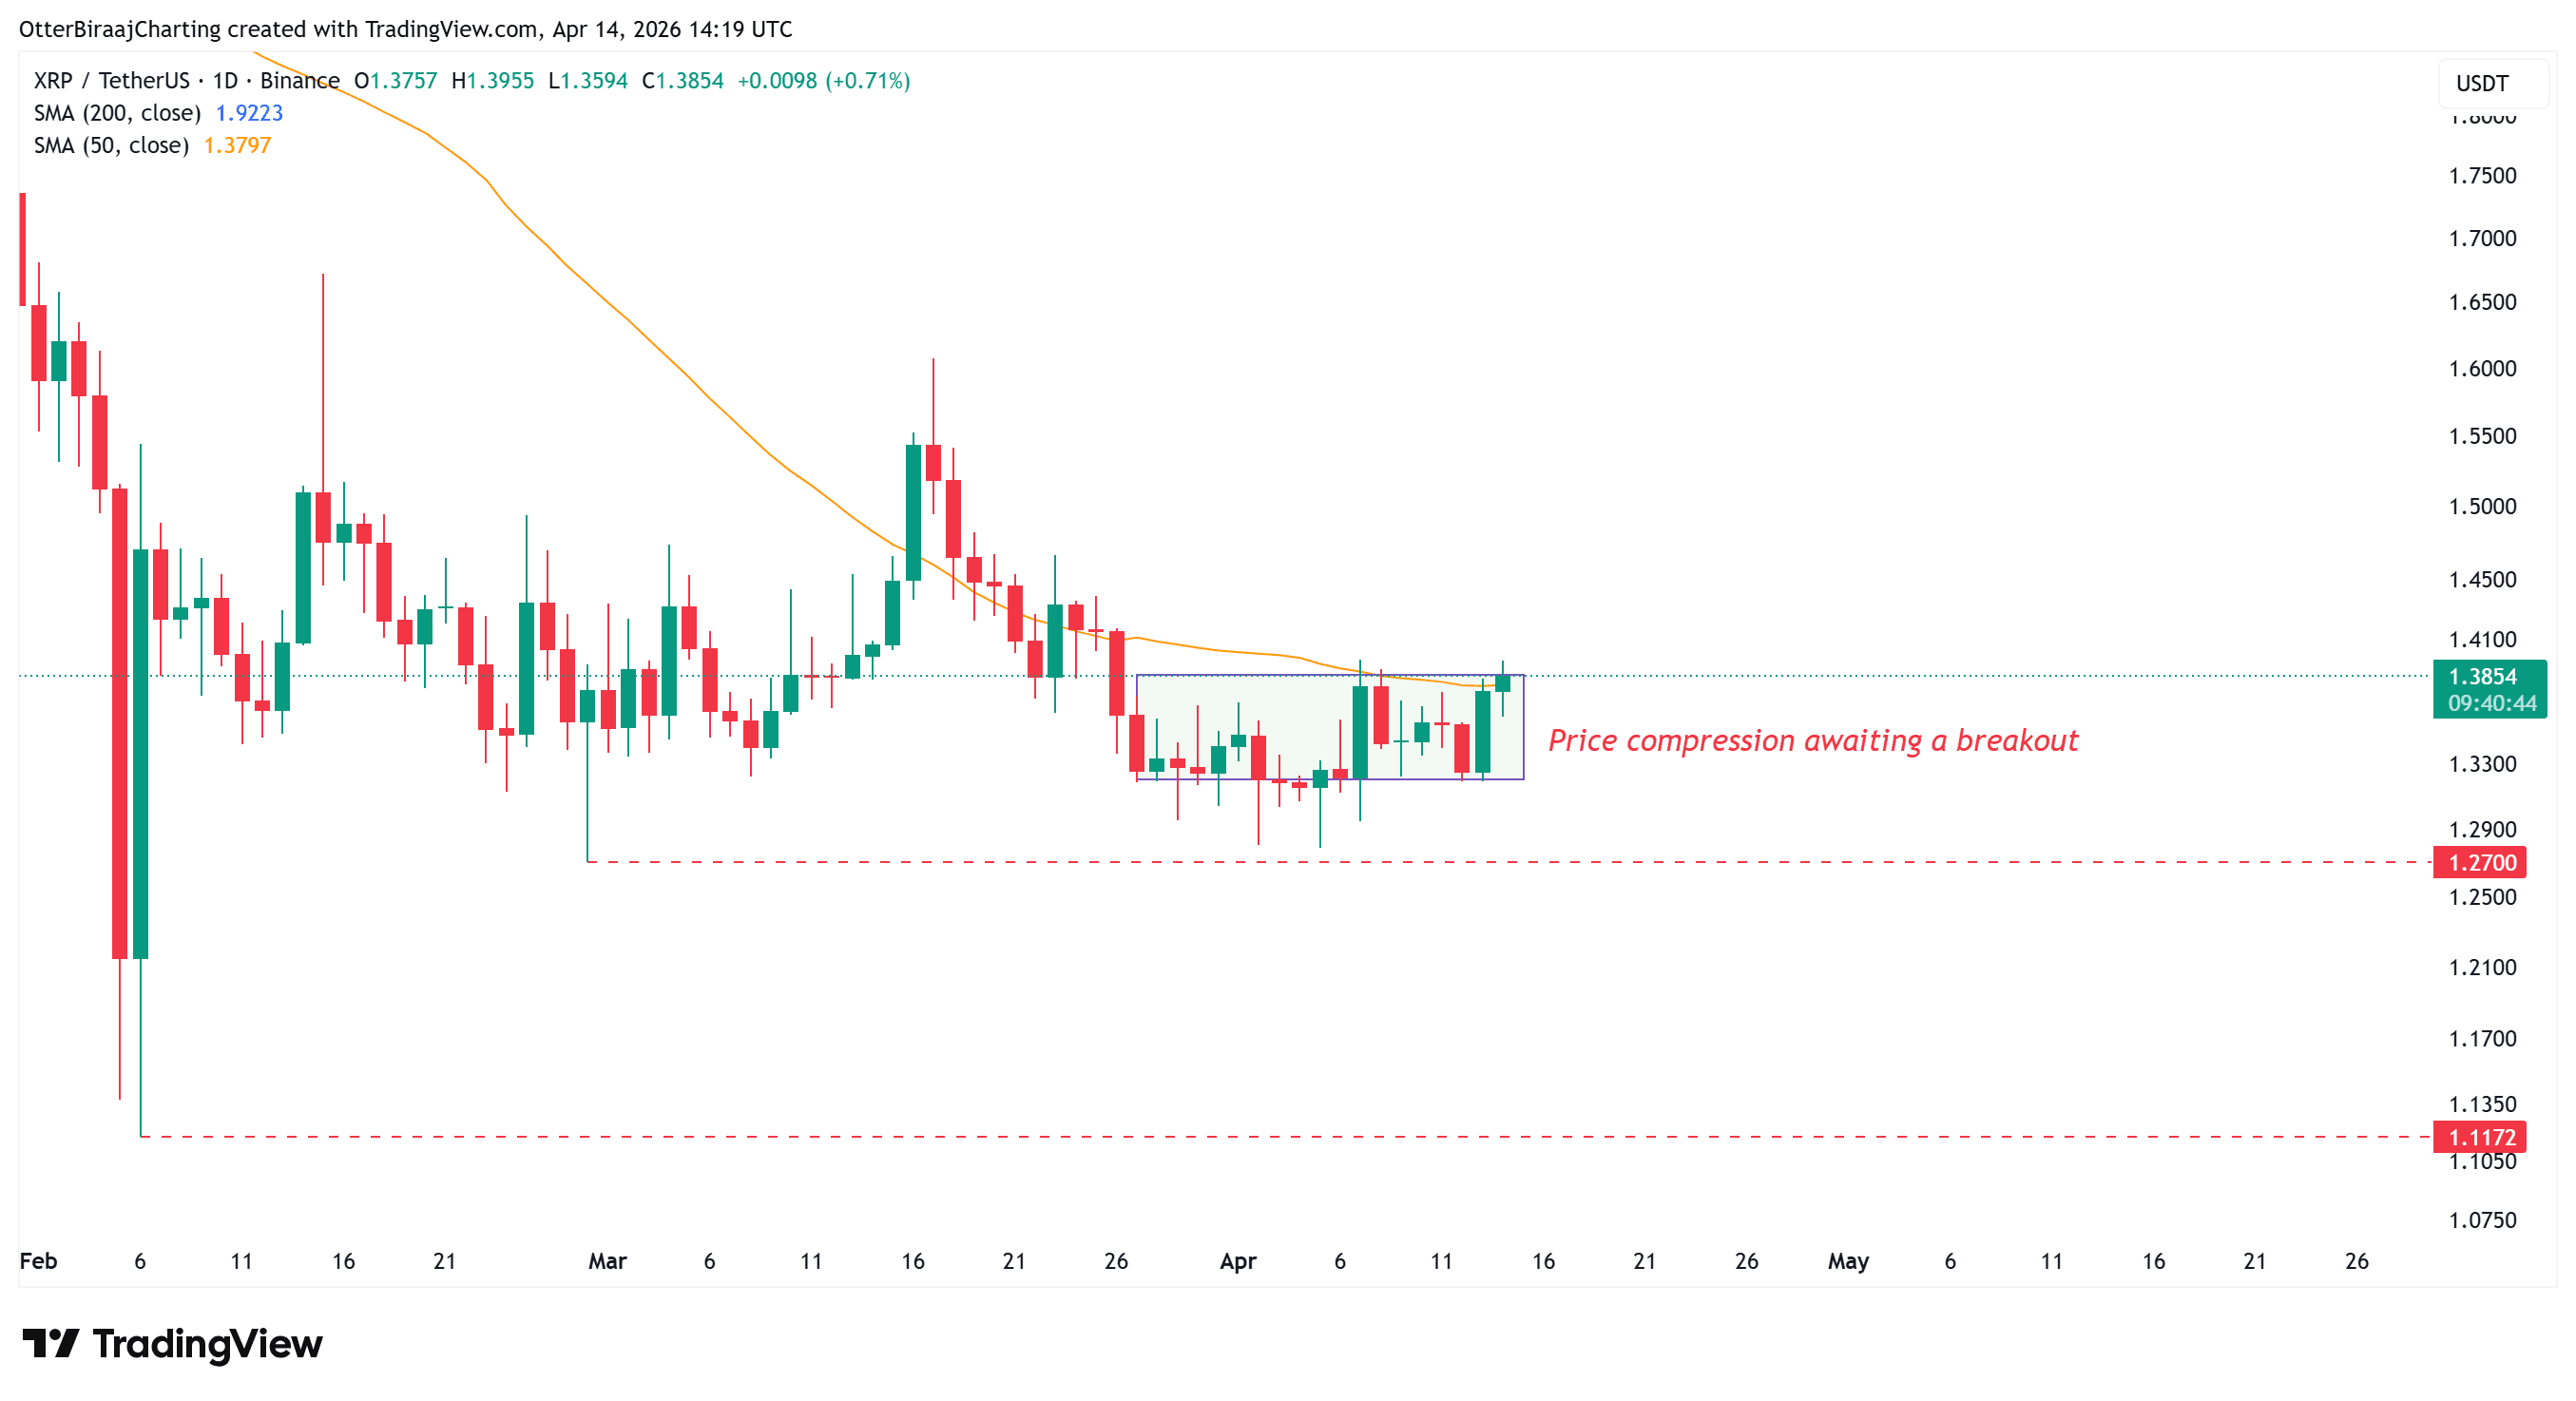
XRP/USDT on the one-day chart. Source: Cointelegraph/TradingView
Crypto analyst Amr Taha noted a shift in XRP activity on Binance, with transaction flows moving away from deposit-heavy behavior. The seven-day average shows XRP withdrawals rising to 53% while deposits dropped to 46%, returning to the levels last seen in June 2025.
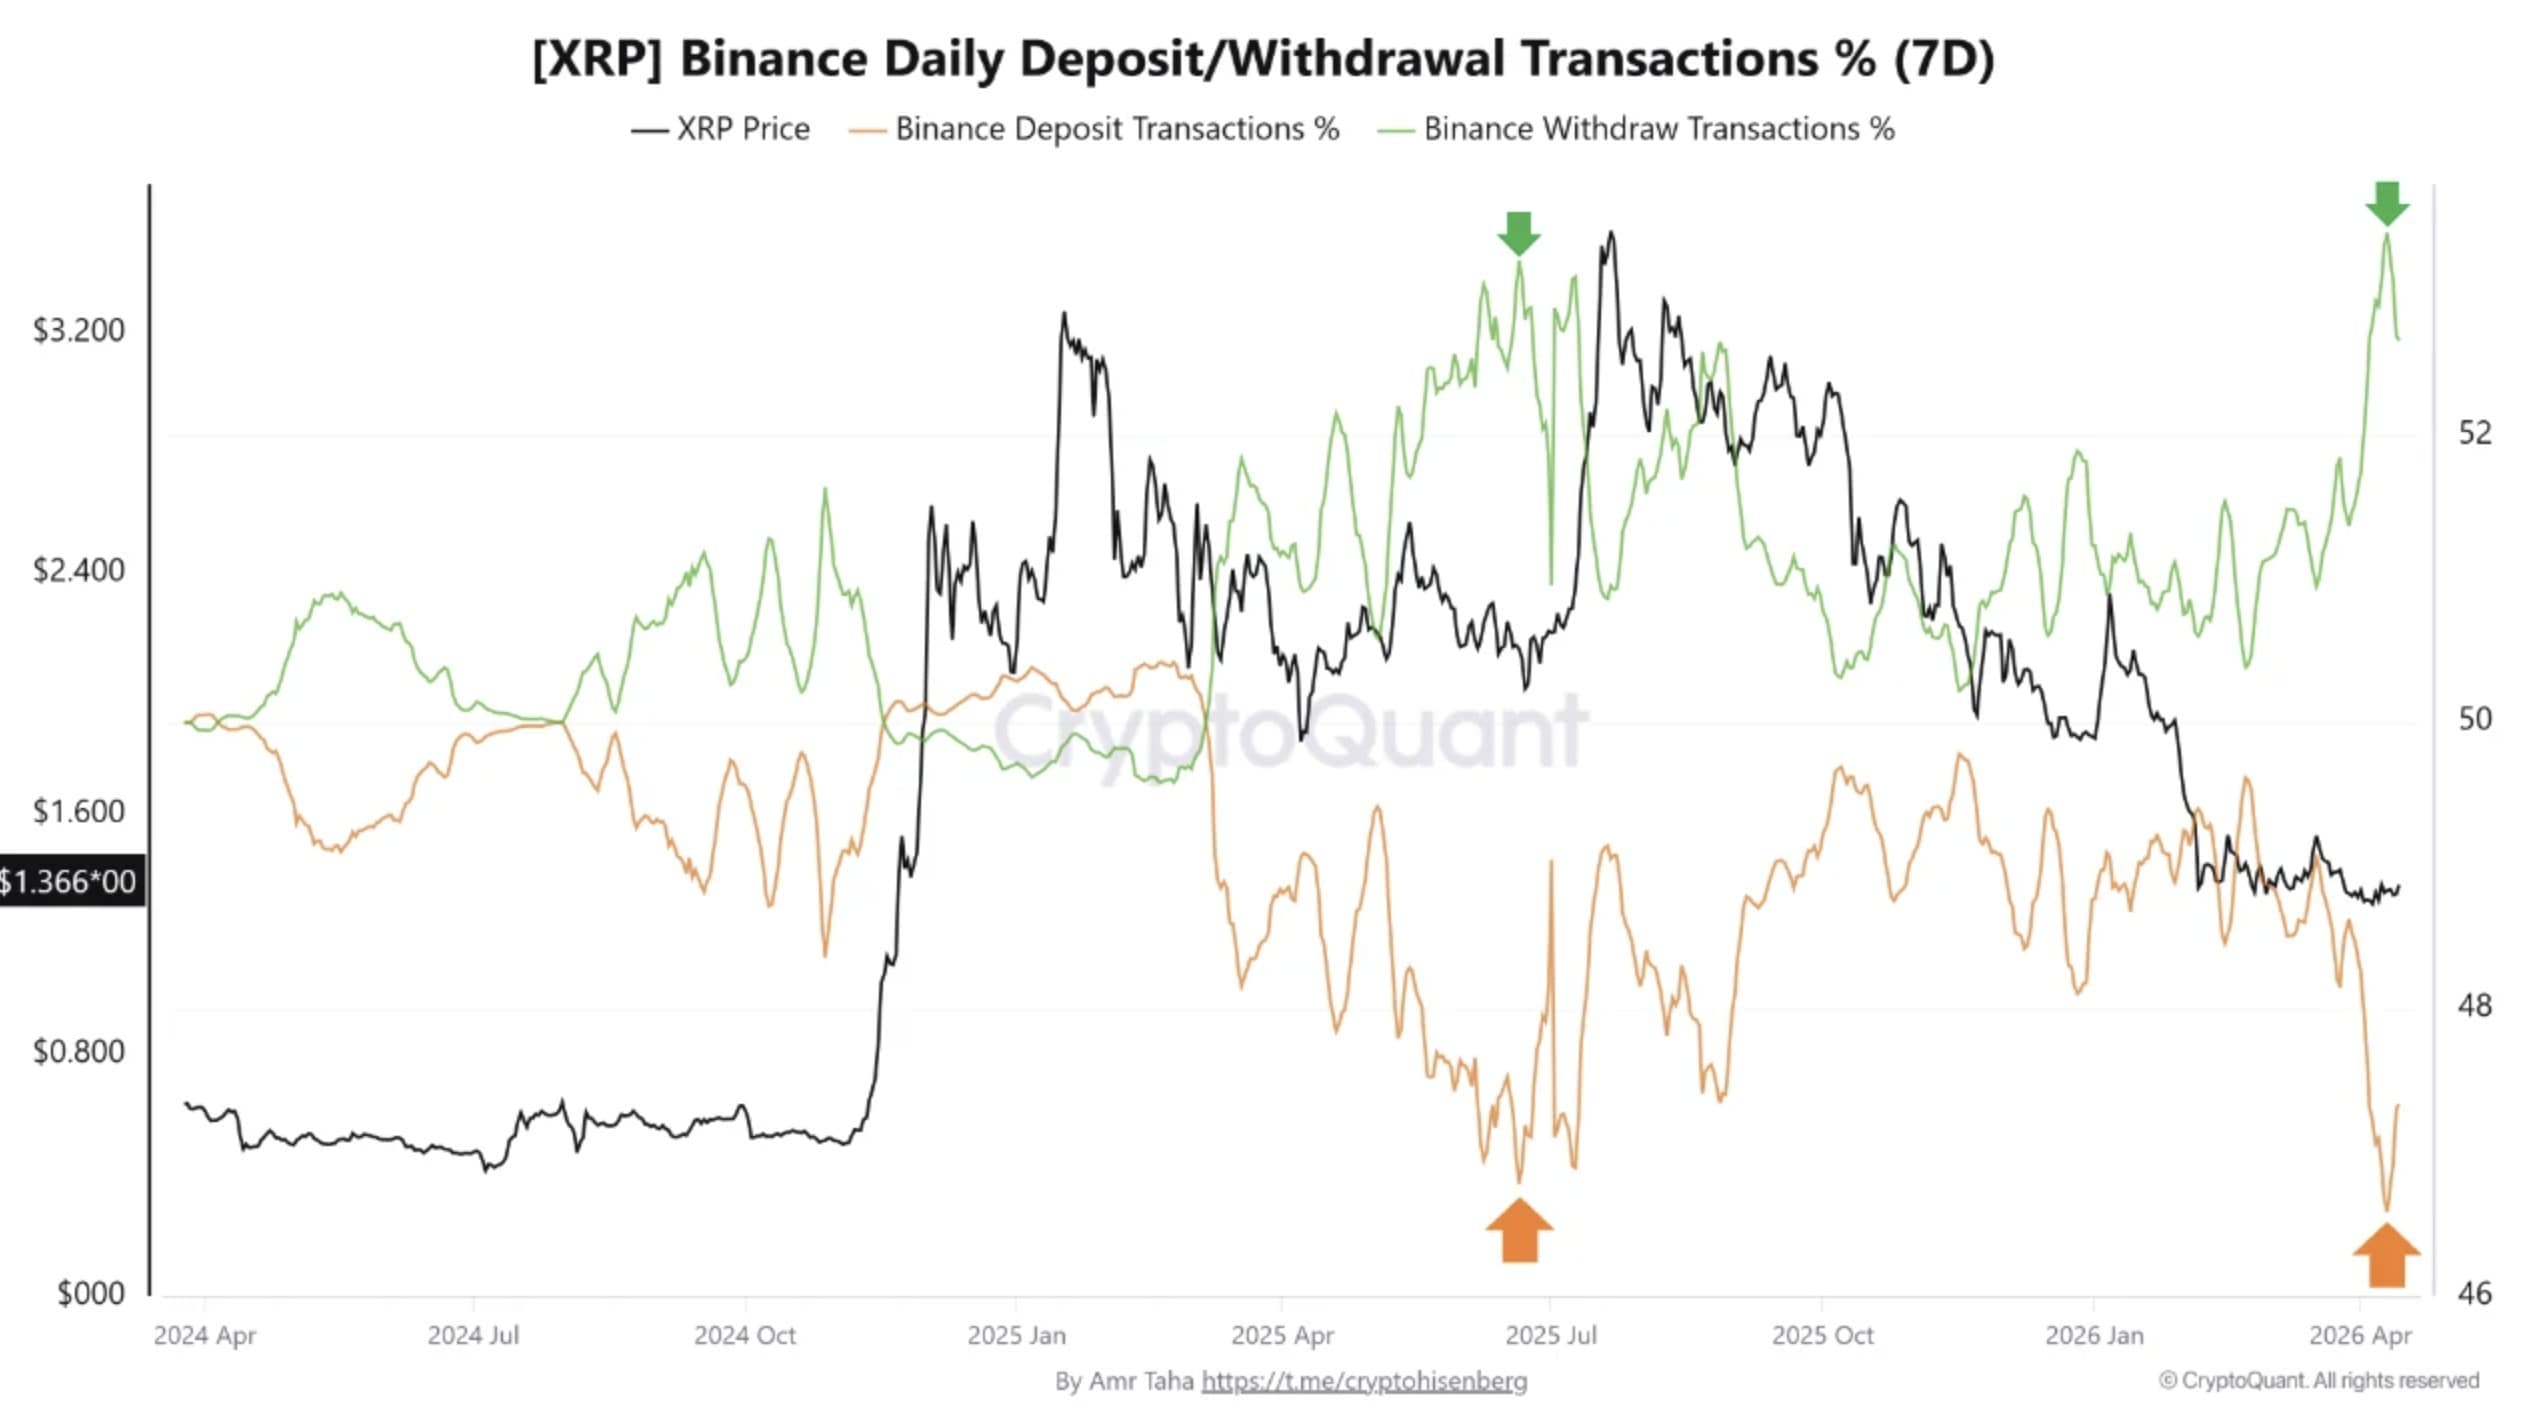
Binance daily deposit/withdrawal transactions. Source: CryptoQuant
That prior setup aligned with a 65% XRP rally to all-time highs of $3.65 in July 2025, placing the current shift on traders’ radar.
The falling deposit activity signals fewer coins moving onto exchanges, while rising withdrawals indicate assets leaving exchanges. This reduces immediate sell-side pressure if sustained over multiple trading sessions.
Currently, XRP flow on Binance is no longer dominated by incoming supply. This indicates a change in trader positioning, with fewer participants preparing to sell into the market.
Topping $1.40 could signal a bullish breakout for XRP, potentially leading to a significant price rally.
Recent changes in Binance's withdrawal and deposit activity suggest reduced sell-side pressure, which may contribute to a price increase for XRP.
In June 2025, XRP experienced a rally that took its price to $3.65, a trend that current data suggests could be repeating.
XRP deposits on Binance have dropped to 2025 lows, indicating a significant change in trading behavior that may impact its price dynamics.
XRP's 'fixCleanup3_1_3' amendment achieves 100% consensus, activating soon!
US Treasury imposes sanctions on Sinaloa Cartel associates for crypto money laundering.

Analyst Highlights Ethereum 'Kill Zone' for Optimal Buying

Bitcoin may enter a critical pullback phase if it falls below $74,929.

XRP sees whale accumulation amid market uncertainty, down 5% this week.

Bitcoin may be poised for outperformance against stocks and bonds as inflation persists and bond markets weaken, according to Mark Connors. After a historic 142-day underperformance against the S&P 500, bitcoin is now in a consolidation phase shifting towards outperformance.
See every story in Crypto — including breaking news and analysis.
Meanwhile, liquidity has contracted sharply. CryptoQuant data shows XRP's 30-day liquidity index on Binance dropping to 0.053, the lowest level since 2021. The 30-day trading volume stands at nearly 3.77 billion XRP, marking one of the weakest periods of activity in recent years.
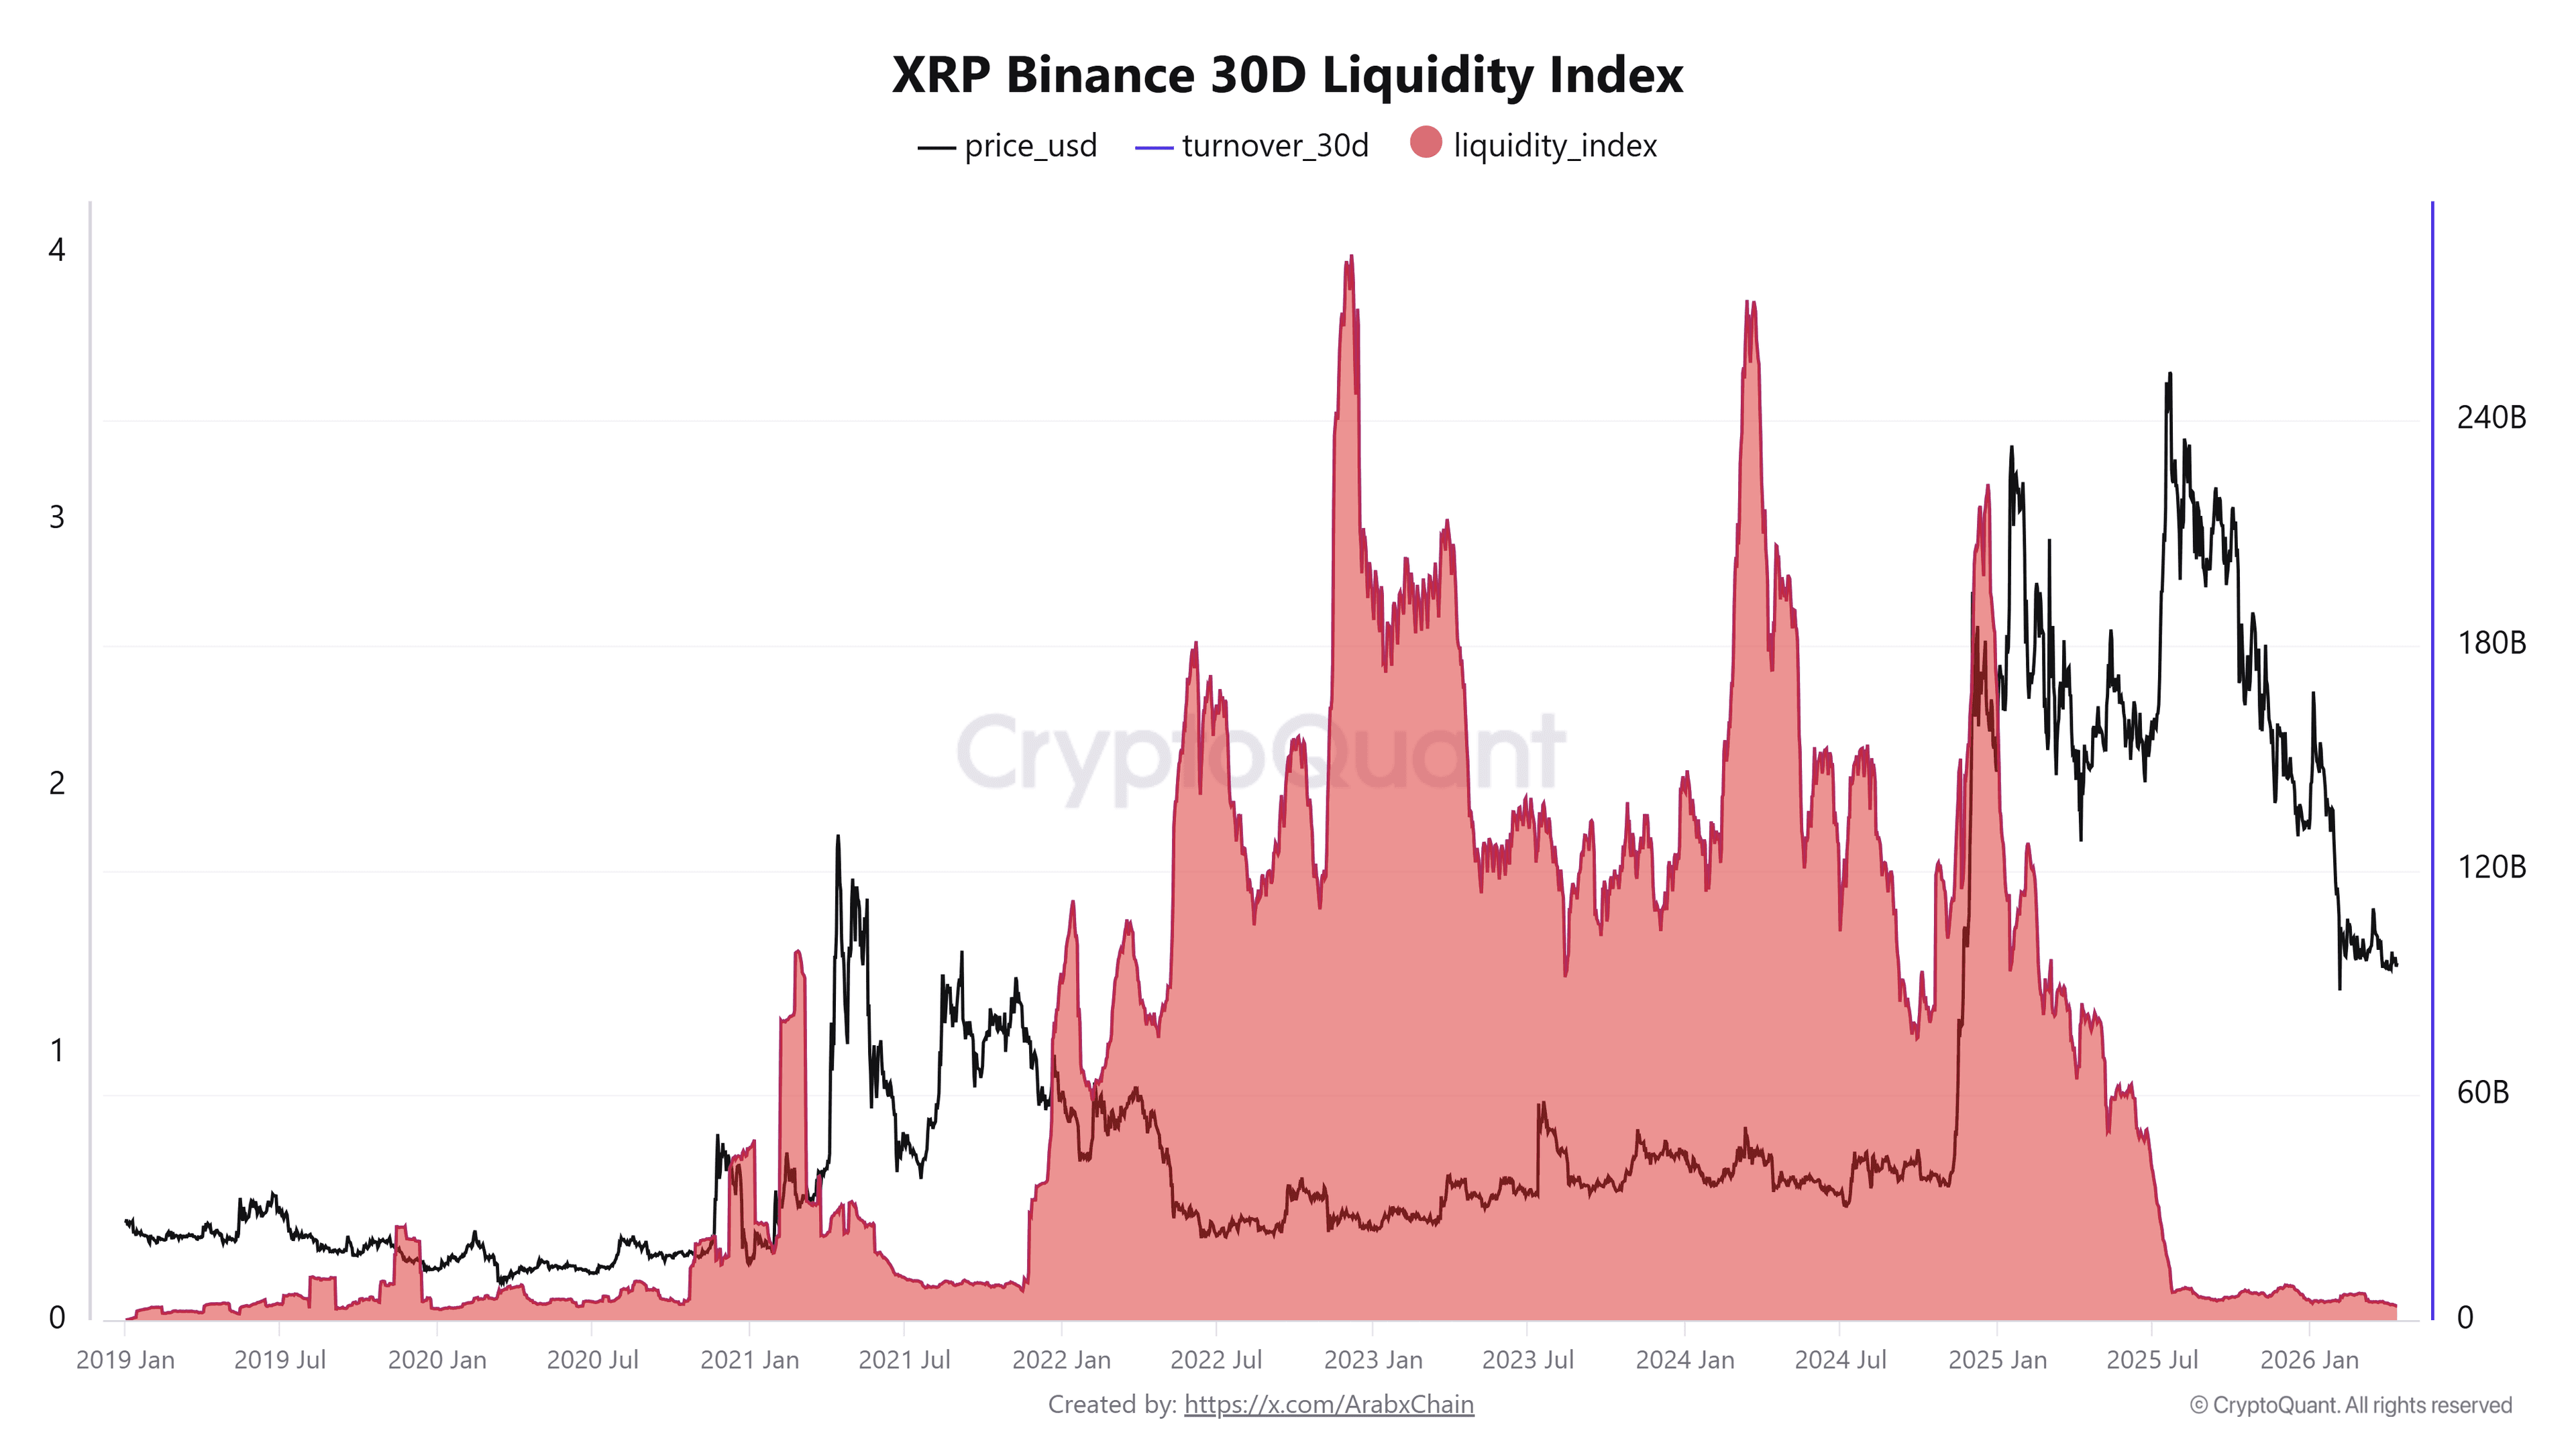
XRP Binance liquidity index. Source: CryptoQuant
The price action aligns with this slowdown. XRP trades near $1.38 with limited movement over the past three weeks, consistent with a quieter order book and reduced trader participation. These lower-liquidity phases may coalesce momentum and precede a stronger directional move once activity returns.
While XRP price consolidates, onchain data shows an aggregated spot cumulative volume delta (CVD) of -$153 million and a futures CVD near -$295 million, pointing to a reduction in aggressive selling.
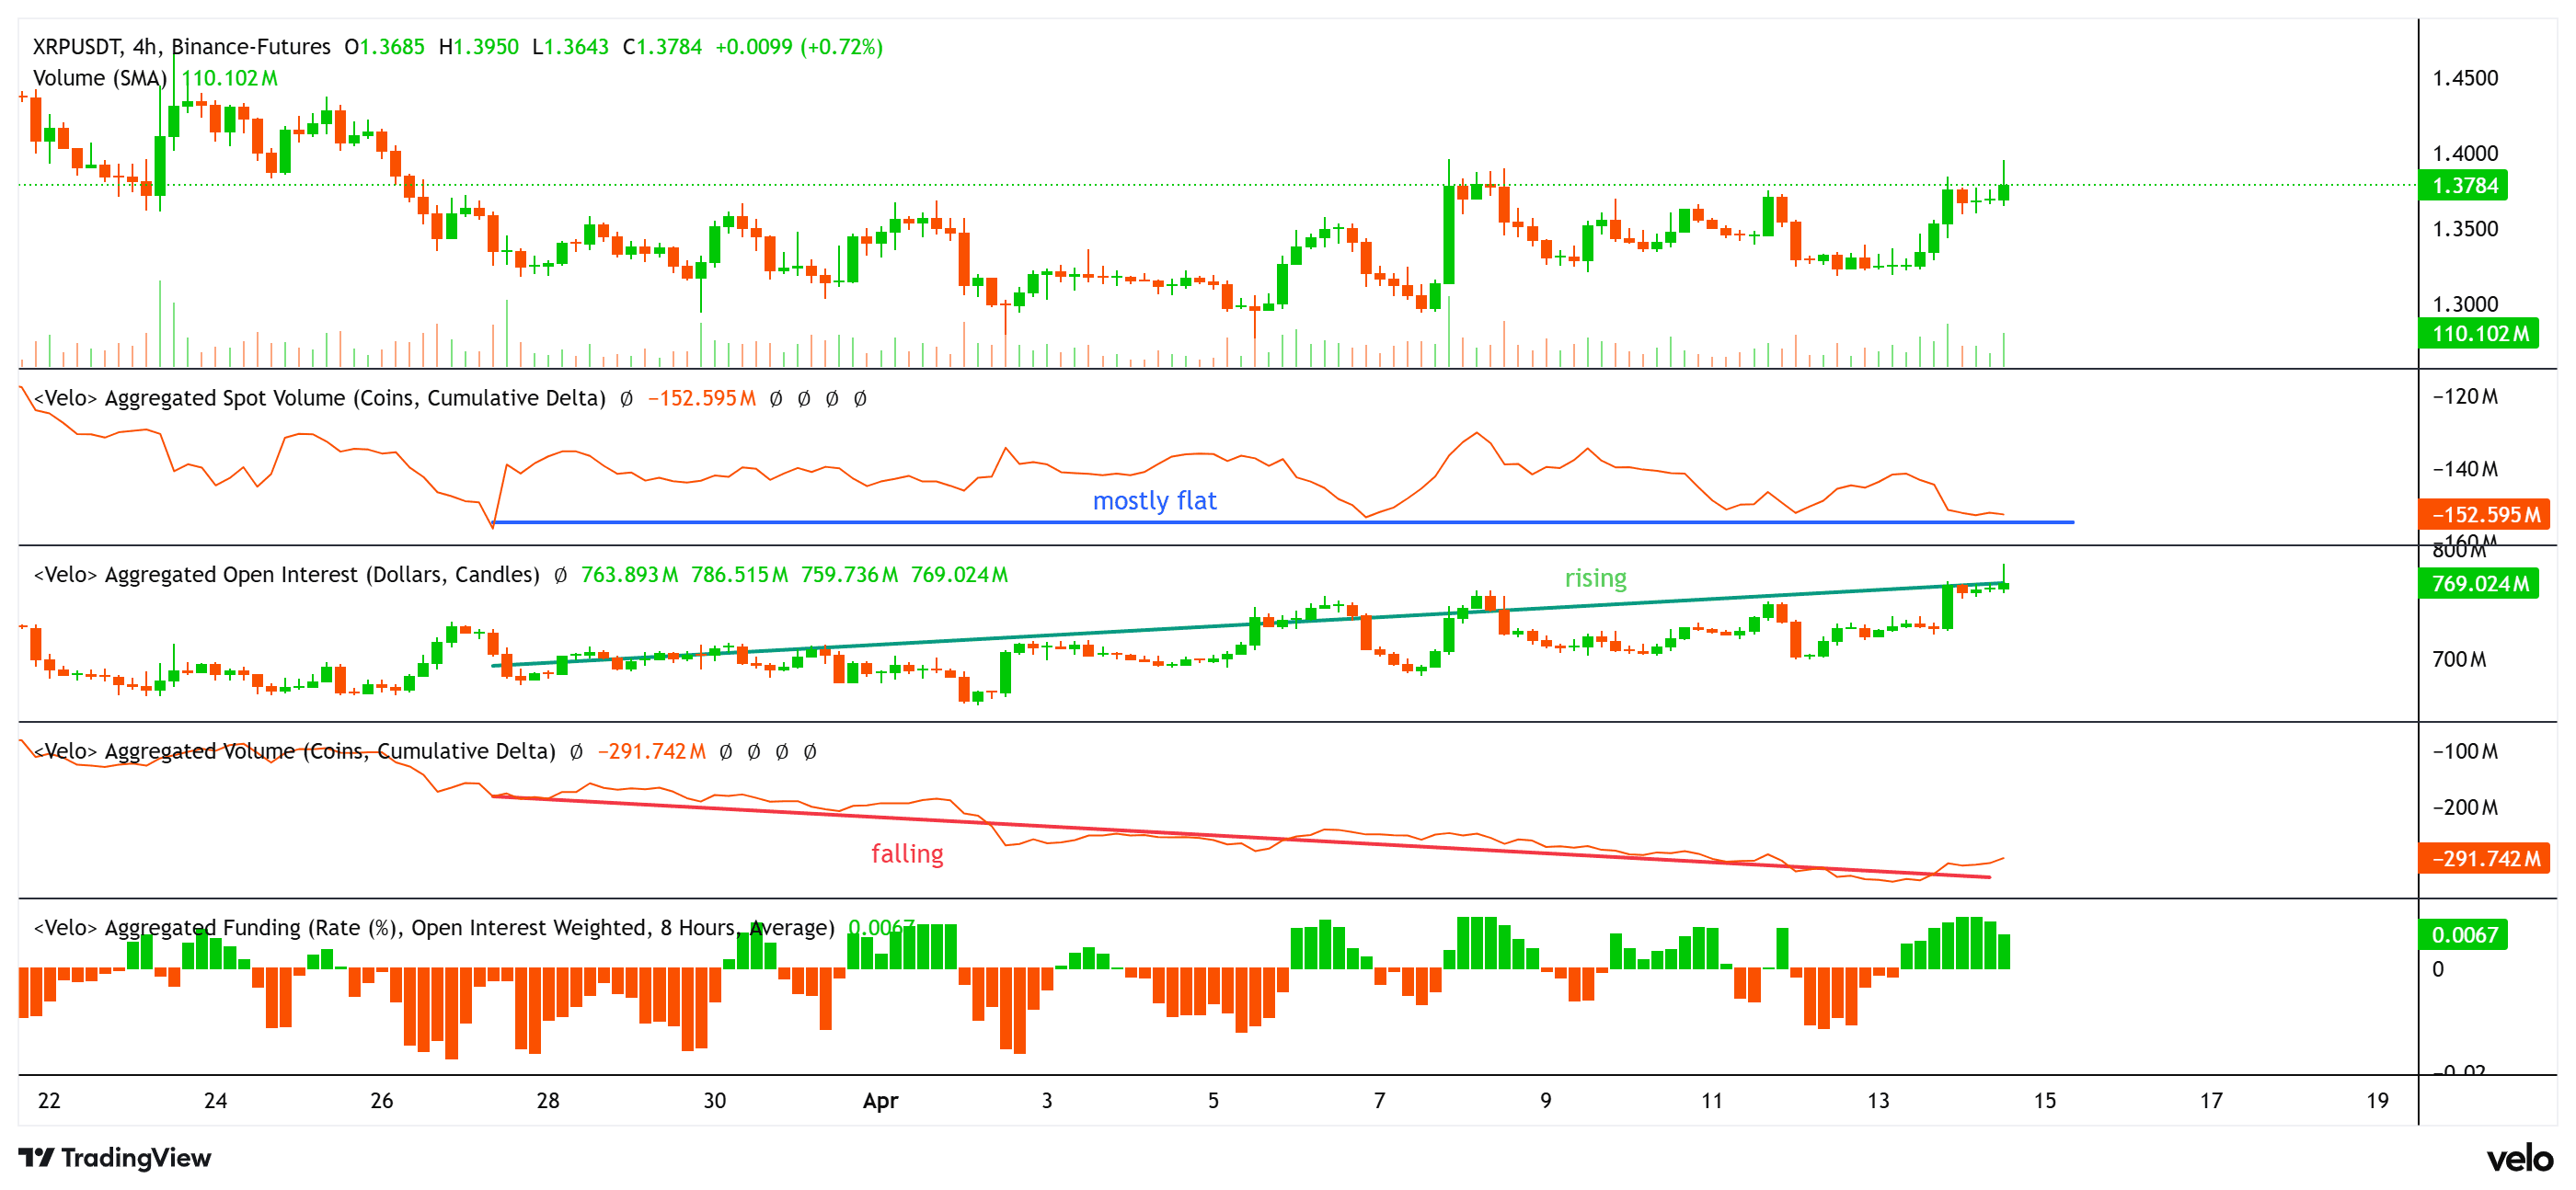
XRP price, aggregated open interest, funding, spot, and futures CVD. Source: velo.chart
The buy-side activity has not expanded, keeping the price movement muted. The funding rates have turned slightly positive at 0.06%, signaling a mild long bias.
Open interest has climbed to nearly $769 million, suggesting fresh positions are entering the market.
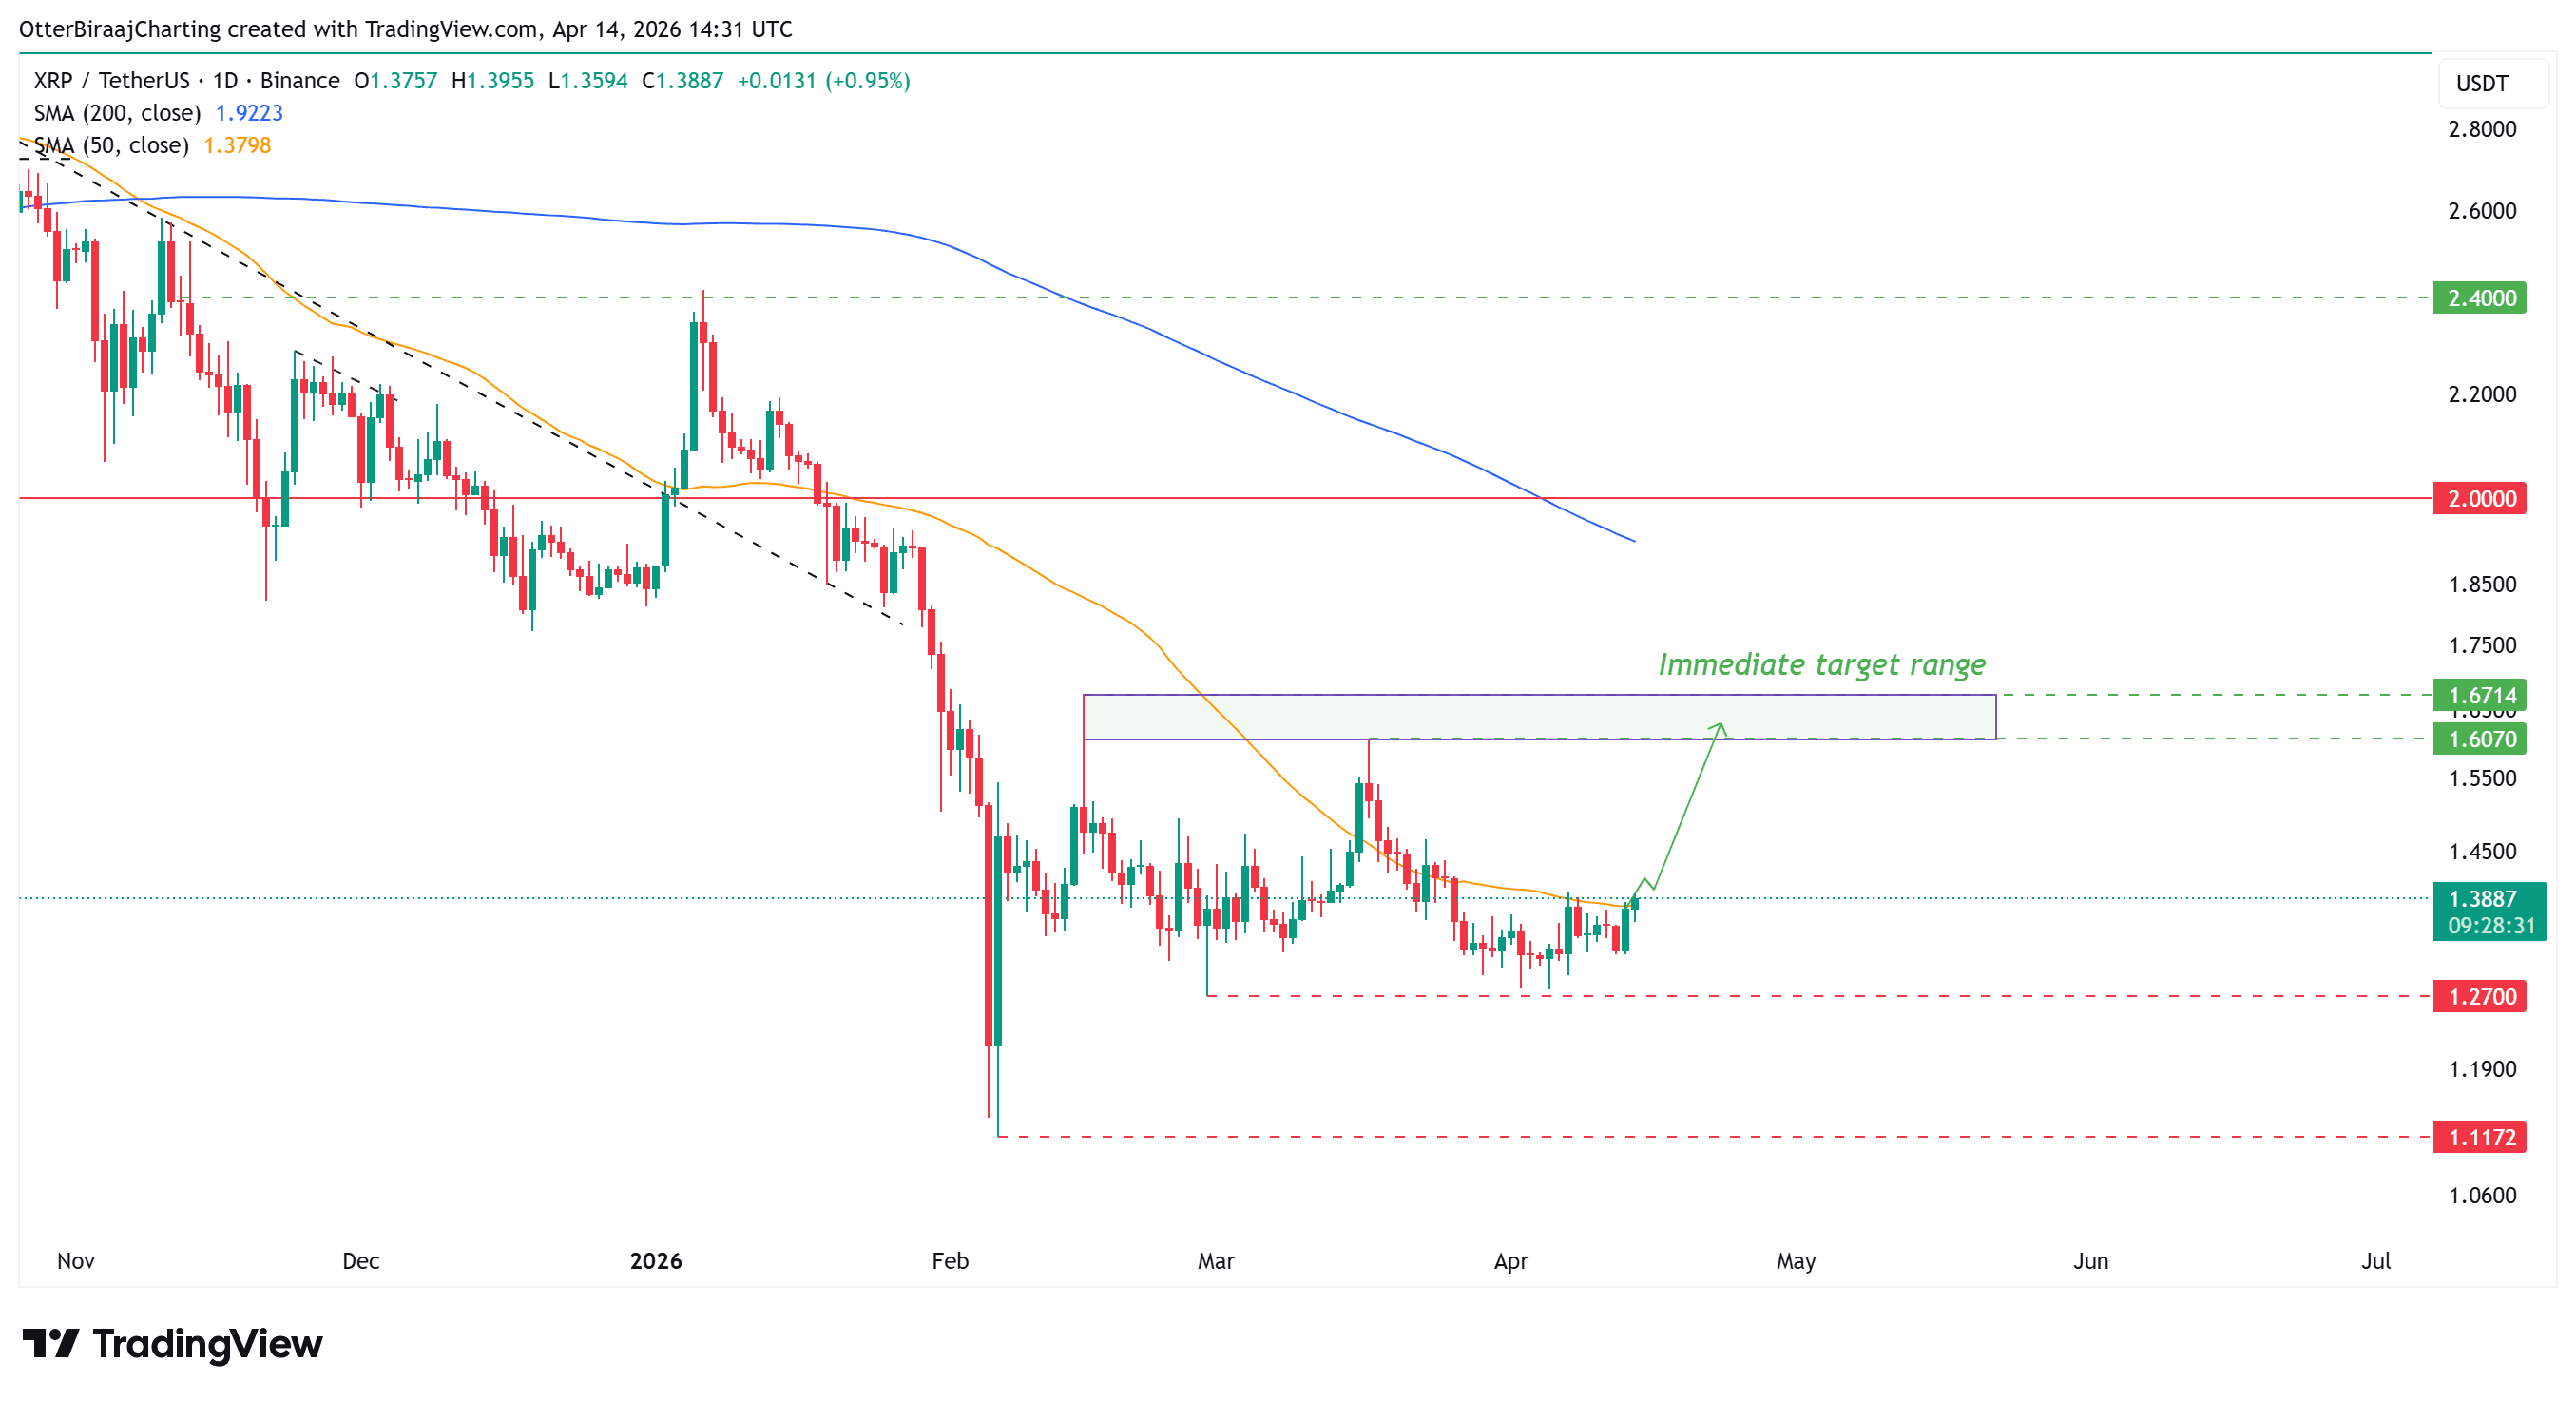
XRP/USDT on the one-day chart. Source: Cointelegraph/TradingView
From a technical perspective, a daily close above $1.40 opens the door to $1.60–$1.67. That $1.40 level also aligns with the 50-day moving average, which may flip into support on a bullish breakout.